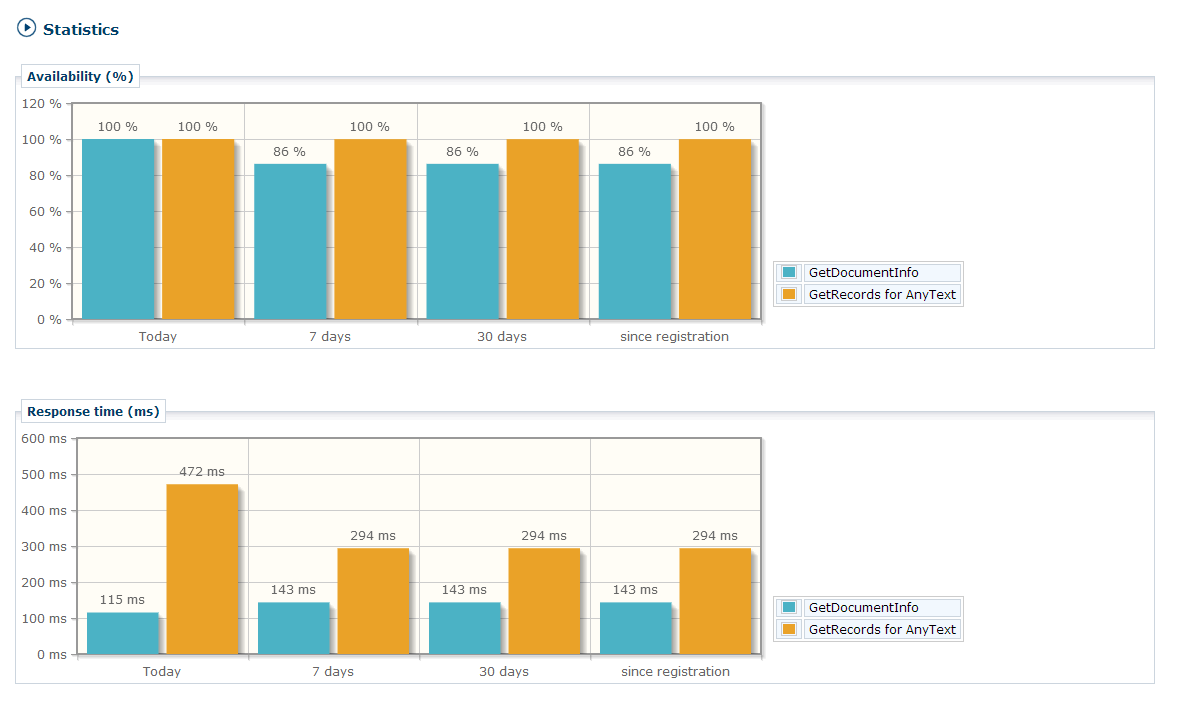
Statistical diagrams
Statistics can be displayed for dashboard selected ![]() jobs.
Each jobs that has been prior selected is depicted in a different color.
jobs.
Each jobs that has been prior selected is depicted in a different color.
The following statistical measures are available:
-
Availability
-
Average Response time in ms
-
Sum of HTTP errors
-
Sum of service exceptions
-
Number of Timeouts
-
Number of total requests
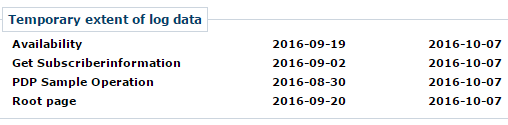
To make the calculation more expressive you can define a custom time slice. Please make sure to understand the time extend of the log data available for each job.