Diagram widgets
There are several diagram types available for a quick monitoring data analysis:
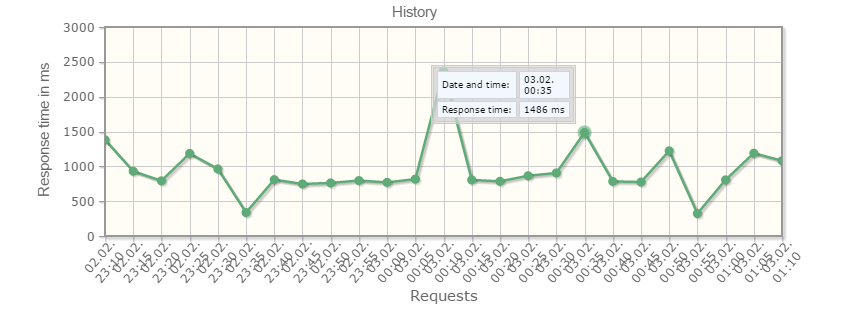
- history of the most current requests
-
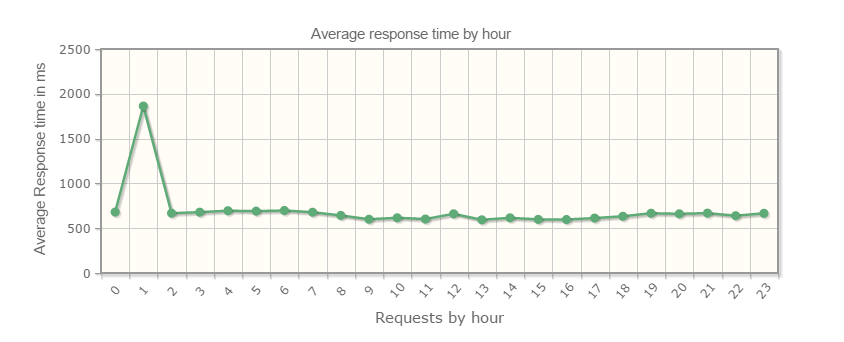
- an average view on all requests by hour of day
-
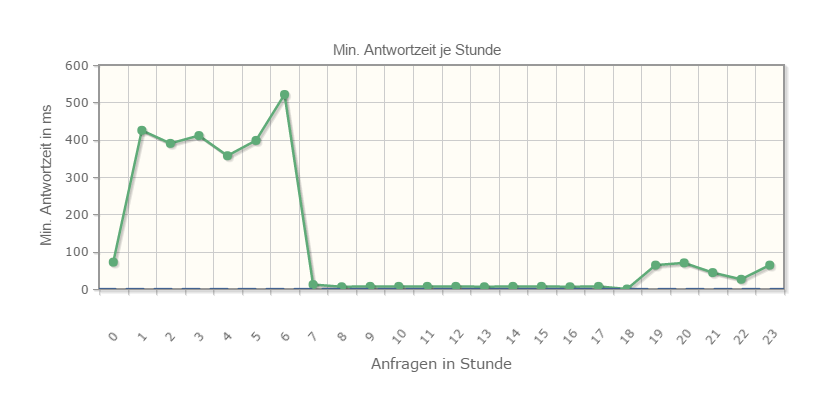
- minimum response time by hour
-
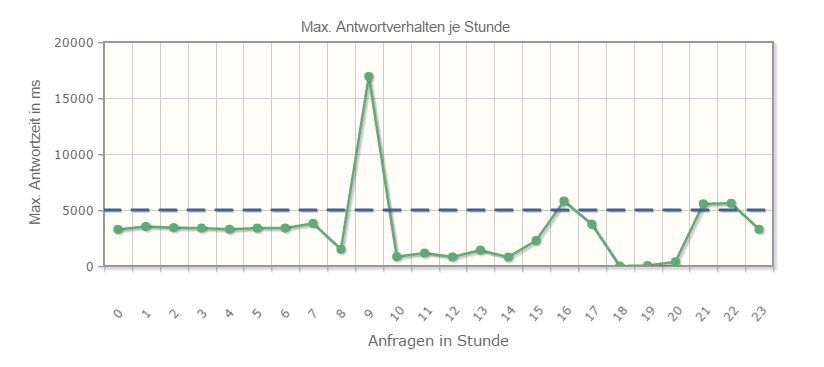
- maximum response time by hour
-
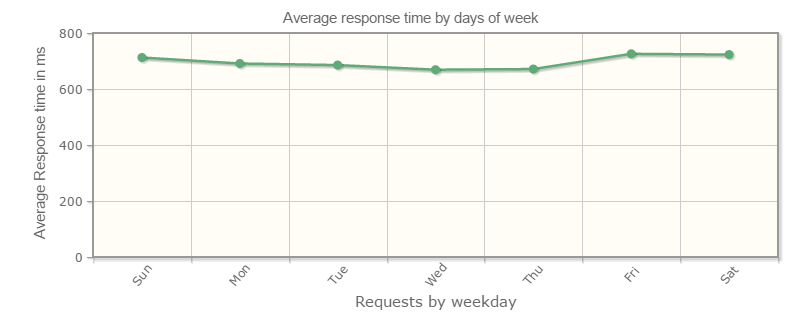
- an average view on all requests by day of week
-
| External Pages can include diagrams via URLs. Please see the URLs on the bottom of the page. |