Service & Job Management
The Service & Job Management page contains an overview of all services and jobs being monitored at the moment.
The page comprises of the following subsections and functions:
Critical jobs

This section displays the jobs that are currently in a critical state. A click on the job name highlights the job in the table accordingly.
Filter
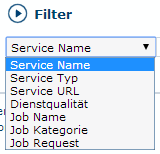
This section provides means to filter the service/jobs table according to specific attributes. These include:
-
Service name
-
Service Type
-
Service URL
-
Service Availability
-
Job Name
-
Job Category
-
Job Request
Simply select a filter type and start typing a phrase in the input field. The filter is applied immediately and the matching attributes are highlighted.
| Hit the Escape key to reset the filter and show all services again. |
Menu
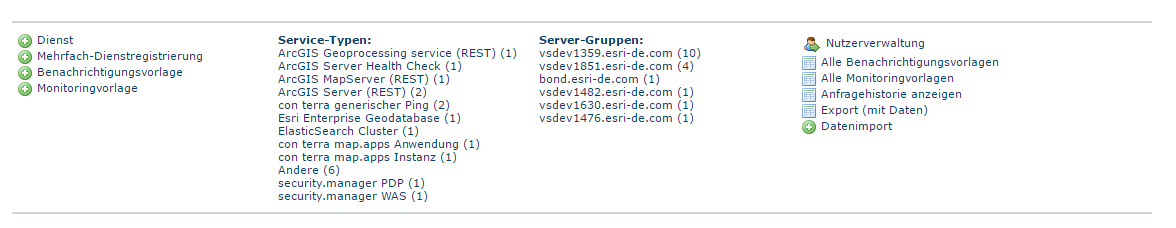
The menu section comprises of several entries:
 Service
-
Register a new service to be monitored by the application
- Server batch registration
-
Provide an map.apps app or ArcGIS for Server REST Url to completely monitor an instance
- Notification template
-
Create a new Notification template defining how, when and on what channels you like to be notified.
- Monitoring template
-
Create a new Monitoring template defining when and how often services shall be monitored.
- Service typey
-
show Service and jobs filtered by their type A click onto a host filters the current view to that host group.
- Host Groups
-
A comprehensive overview about all host being targeted by monitoring. A click onto a host filters the current view to that host group.
 User Management
-
Opens the security.manager to work with the user management. This option is only visible to users owning the role
sM_Administrator.  All notification templates
-
Gives you access to all available notification templates.
- All monitoring templates
-
Gives you access to all available monitoring templates.
- Show request history
-
Gives you access to list of all request sent by service.monitor
- Export (including data)
-
Creates an export of all services and templates A click on including data also exports the collected monitoring data.
- Data import
-
Import of services, templates and data
| The menu options to (batch) register services only become visible if you’ve already created templates (monitoring & notification) such services can refer to. |
Server Batch registration
Batch registration is a convenient way to automatically create new monitored service instances derived from MapServices and FeatureServices available on an ArcGIS for Server instance or services referenced in an con terra map.apps instance.
- ArGIS for Server
-
-
MapServer and FeatureServer can be derived from an ArcGIS for Server for monitoring.
-
Please provide an ArcGIS for Server Catalog REST URL, i.e.
http://services.conterra.de/arcgis/rest/services.
-
- con terra map.apps
-
-
Please provide an url to the apps folder, i.e.
http://www.mapapps.de/mapapps/resources/apps
-
- con terra security.manager Enforcement Points
-
-
Please provide an url to administration webapp, i.e. http://products.conterra.de/administration (if both products are not operated on the same host, it is necessary to allow access to the REST service, see configuration value
security.allowed.hostnamesin security.manager) -
Please also specify the templates to be used for notifications and monitoring.
-
The checkbox allows the specification about sending notifications about the creation of each individual job.
-
Data export / data import
The data export/import is primarily used to transfer services and their collected data from one monitor instance to another instance. Please note that all objects (monitoring, notification templates as well as services and jobs, but also export data) are exported with their IDs and must not already exist in the database when imported. The existence of duplicate IDs is checked by service.monitor before the import.
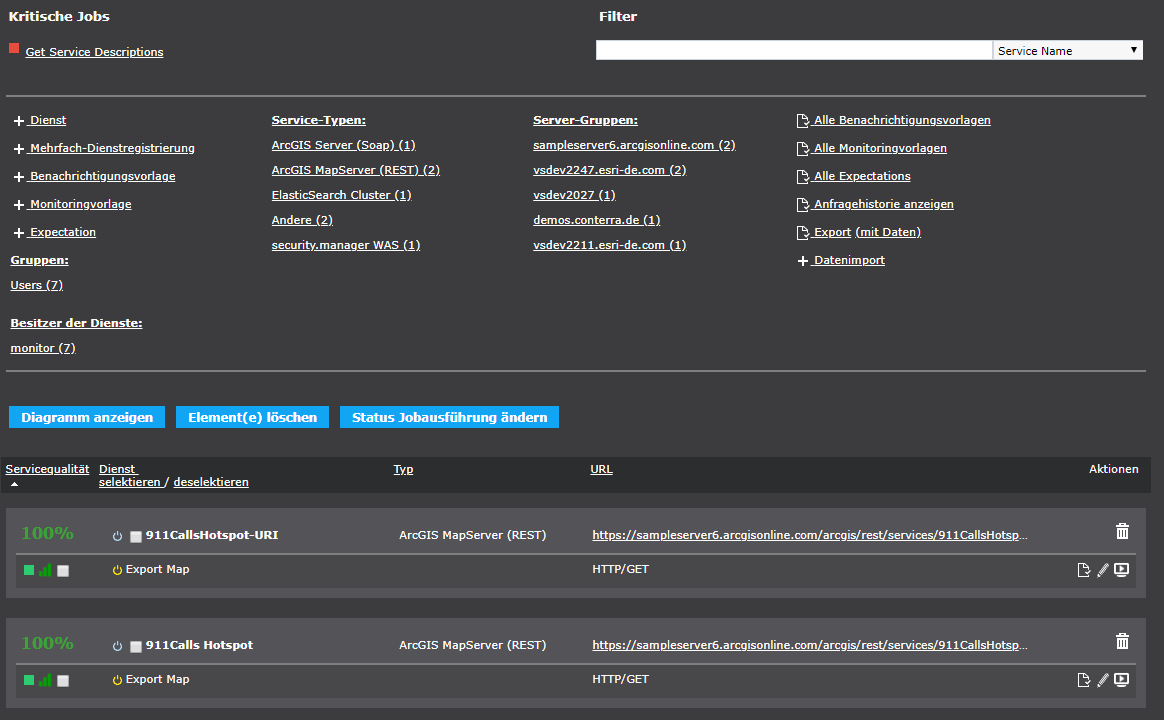
Service & Job List
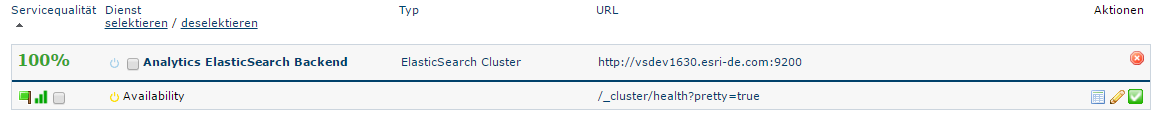
The content section lists all monitored jobs and services that are visible to the user along with a number of attributes and functions. These include:
Section |
Features |
Description |
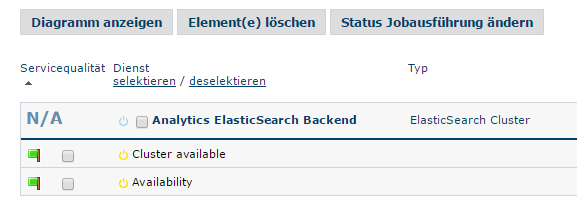
Service health |
99% |
A percentage value displaying the actual health state of the service (see info panel below). |
|
The status of a service job being monitored is displayed using a traffic light system.
|
|
|
By clicking this icon a linear diagram is shown that depicts the response times of the last 10 requests of this job. |
|
|
Wobbler indicating latest monitoring activity. |
|
|
Button to toggle monitoring activity on all jobs of this service. |
|
|
Enable this check box to mark this job for further actions (see below). |
|
Service |
Service name |
The service name is displayed on top of each row. Here: "join" |
|
Button to toggle monitoring activity on this job. |
|
|
Enable this check box to mark this service for further actions (see below). |
|
Job name |
The single job names belonging to a service are listed below the service name. Here: "static - http get - ping" |
|
Type |
Service type |
The type of the service being monitored Here: "AGIS_MAP_REST" |
Job category |
The job category that has been selected for each job. Here: <no category> |
|
URL |
Service URL |
The base URL of the service instance. Here: "http://services.conterra.de/arcgis/rest/…" |
Query string |
The HTTP GET query string that is sent along with the job request. Here: "/?f=pjson". |
|
Actions |
|
Deletes the service entirely, along with any associated job. |
|
Opens the job’s detail page. |
|
|
Open the job’s edit page. The edit page also allows to edit the according service as well. |
|
|
Immediately triggers the execution of a job. |
- Services
-
Sorting & Hyperlinks
- You can sort any column of the content section in ascending or descending order by clicking on the head labels
-
Availability, Service, Type, URL.
You can also click the service URL or a job’s HTTP GET request to open up a new browser window following that URL or request.
Understanding service health measurement
| It’s quite hard to find a common understanding of how a comparable number of a job’s service quality can be defined and of course there may be different approaches available when to indicate a service is performing worse than another. |
Currently the "health" value of a service is calculated by calculating the average health value of all public jobs of this service. The health of a job here is determined by the average health of the last historized monitoring request set in relation to the response time value which has been defined by the job creator.
However service.monitor offers extension points to change the health calculation by custom code. Please ask for professional services if you have specific needs.