Dashboard controls
Diagram types and controls
Filters
Filters are available on all dashboards and allow you to quickly change the current view of the dashboard according to different criteria. The value list of the filters is determined dynamically on the basis of the collected data and is sorted in descending order according to the frequency of occurrence of the values. Alternatively, the entries can also be sorted alphabetically.

The following filters are predefined in the product dashboard definition:
-
Time
-
map.apps app name
-
Browser
-
Platform (desktop/mobile)
-
mobile devices of the users
-
operating system
-
Geo-Ip: City
-
Geo-Ip: Area
-
Geo-Ip: Country
-
Log level of the message
-
Authentication status of the user
-
User
-
Role
-
Group/Organisation
-
Server
-
Protocol (http/https)
-
Service url
-
Message source (map.apps / security.manager)
-
Name of enforcement point
-
name of protected service (ArcGIS for Server)
-
Authentication scheme when using the protected service
-
Service type of the protected service (ArcGIS for Server)
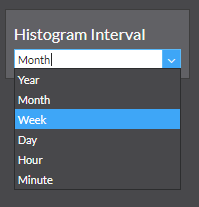
Set aggregation period for histogram
The setting for the aggregation period is also available in the form of a filter. This element affects all histograms of the dashboard. If the value is changed, all histograms are reloaded with the newly set aggregation period.
| Choosing a short interval with a large time extension will extend the runtime of the server query. |
Manual / automatic refresh of widget objects
The individual diagrams update themselves, but can also be generated only once when the dashboard is set up. Furthermore, there is always the possibility of a manual refresh via the update icon, which appears automatically with each widget when the mouse is moved over the widget.
The widgets can also be configured explicitly so that a filter selection has no effect on the respective widget. For more information, see the Developer’s Documentation.