EventStreams
|
EventStreams is an experimental feature based on the research and master thesis of René Unrau at the University of Münster. With the fast adaptation of this new analysis method for the geo-area and the possibility to react flexibly to new requirements, this functionality has an experimental character at present. |
We want to know your opinion about the EventStreams! What is good, what can be improved?
The use of EventStreams is useful for analyzing applications that have a limited range of interaction options, otherwise the amount of information becomes too confusing to be aggregated in a meaningful way. map. apps is a platform that allows you to create many small and targeted applications. Within these applications, a continuous improvement process is to be achieved by means of Deploy-Measure-Optimize cycles.
Typical use case are:
-
Understanding of the use of different interaction possibilities in complex, professional tools/widgets
-
Understand how purposefully users start an application with the expected workflow to start it.
-
Evaluation of exit points within an application
|
EventStream is a complex tool that can and must be adapted and optimized in customer-specific environments. Please contact us to discuss how we can help you with the use of this method for other services. |
The benefits and advantages of data analysis are often not fully exploited due to a lack of visualization, especially for analysts with a less technical background it is difficult to interpret information on a technically focused basis. By selecting suitable graphics and diagrams, service. monitor Analytics supports the identification of trends and problems on classic dashboards.
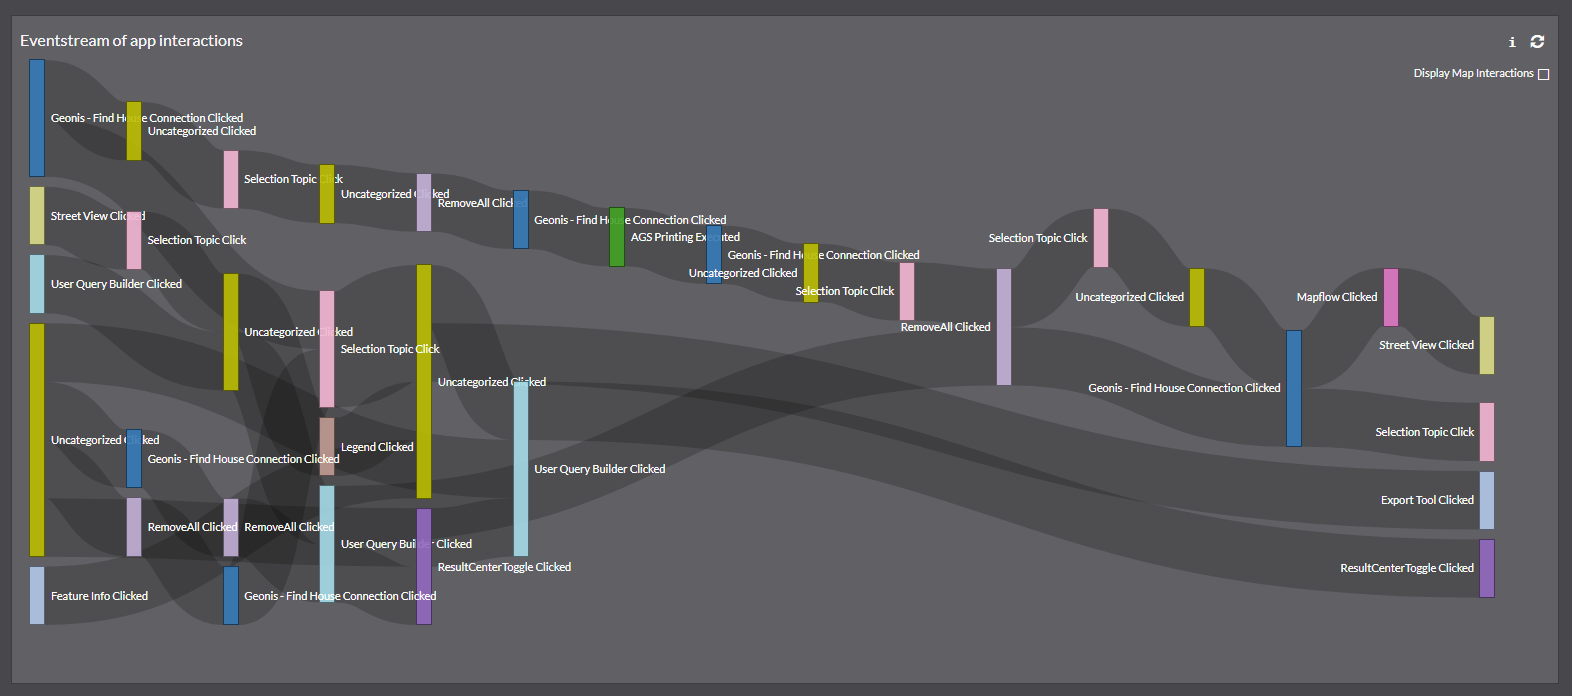
In order to evaluate the usability of a WebGIS based on the analysis of data, it is crucial to develop meaningful and for the geo-sector new data representations. EventStreams are therefore a completely new way of gaining visual access to the user’s workflows in the applications. The visualization of user interactions is a method to compare the acceptance of certain work steps in a client with one’s own expectations.
The data collected in the applications is available in chronological order and can be divided into sessions at the same time. This information can be aggregated and weighted using the bars in the EventStream diagram. If an interaction is carried out at the beginning of many sessions, this can be an indicator of high attractiveness or interest. Based on this, the click and interaction flows in the overall application can be viewed and interpreted.
The context of an interaction also helps to understand why users leave the application after a certain interaction. After identifying the accumulations of a particular interaction that are always executed at the end of a session, the next step is to determine the reason for this behavior and to consider how the application can be optimized at this point in a further cycle.