Customize and extend dashboards
Create an app and create a new dashboard
Creating the app and configuring the new Analytics Dashboard involves the following steps in map.apps Manager:
-
Creation of a new app
custom_dashboard -
Configuration of the
app.jsonfile -
Create a new, local bundle via
manifest.json -
(optional) Adding a new widget configuration
Create a new app "custom_dashboard"
The map.apps Manager allows you to easily create new apps. For the given application, it is sufficient to create a new (and empty) app called custom_dashboard without using a template and then switch to the manual configuration.
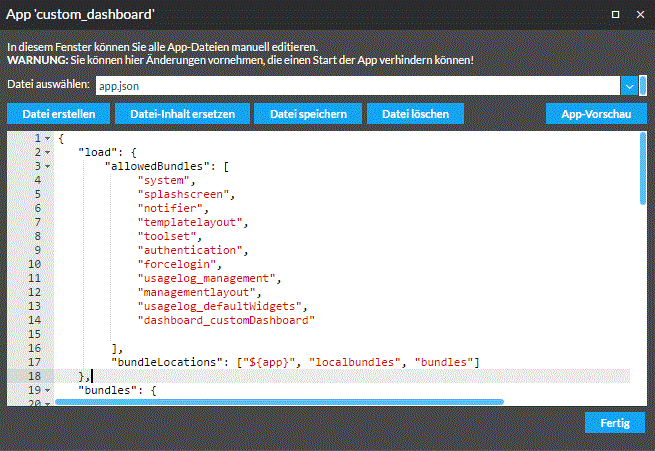
Configure app.json
The following adjustments are made in the app.json file:
-
Integration of the analytics bundles
-
Configuration of local bundles
-
Konfiguration als "Management-App"

First, the necessary bundles are added to the configuration.
{
  "load": {
    "allowedBundles": [
      "system",
      "splashscreen",
      "notifier",
      "templatelayout",
      "toolset",
      "authentication",
      "forcelogin",
      "managementlayout",
      "usagelog_management",
      "usagelog_defaultWidgets",
      "dashboard_customDashboard"
    ],
    "bundleLocations": [
      "${app}",
      "bundles"
    ]
The bundle dashboard_customDashboard does not yet exist, but will be created later in this article. usagelog_defaultWidgets is the widget container introduced in service.monitor 4.2 and contains all widgets used in the product dashboards.
With the extension of the bundleLocations to ${app}, the app is enabled to find local bundles as well.
In the bundles section, the map bundle is removed, since no map abilities are required for this example. This configuration must be used instead:
"templates": {
  "TemplateModel": {
    "_selectedTemplate": "template",
    "_templates": [
      {
        "name": "template",
        "location": "managementlayout",
        "requiresCSS": true
      }
    ]
  }
},
"toolset": {
  "ToolsetManager": {
    "toolsets": [
      {
        "id": "default_tools",
        "tools": [
          "appmanagement_*"
        ],
        "container": "desktopbackground",
        "cssClass": "buildertoolsMenuBar",
        "windowType": "menubar",
        "position": {
          "rel_t": 7,
          "rel_l": 10
        }
      }
    ]
  }
},
"authentication": {
  "RedirectOnLogout": {
    "refreshPage": true,
    "appendReturnUrl": false
  }
}
Creation and configuration of the local bundle
With the function "Create file" you have to create a bundles.json file with the content
{
  "dashboard_customDashboard": {}
}
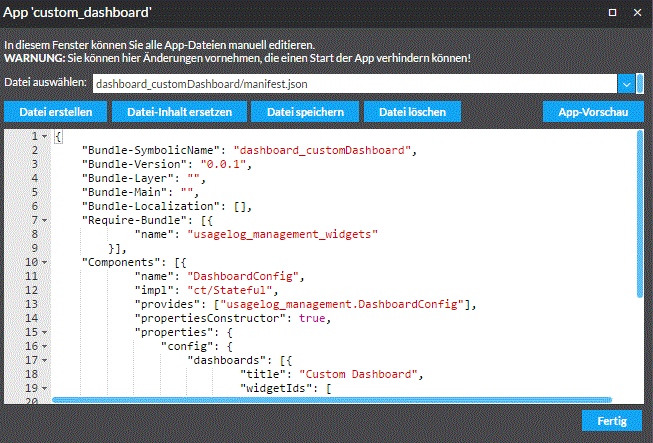
The same applies to the file dashboard_customDashboard/manifest.json.
It defines the dashboards and widgets to be present in the newly created app.
The file content looks like this:
{
  "Bundle-SymbolicName": "dashboard_customDashboard",
  "Bundle-Version": "0.0.1",
  "Bundle-Layer": "",
  "Bundle-Main": "",
  "Bundle-Localization": [],
  "Require-Bundle": [{
    "name": "usagelog_management_widgets"
  }],
  "Components": [{
    "name": "DashboardConfig",
    "impl": "ct/Stateful",
    "provides": ["usagelog_management.DashboardConfig"],
    "propertiesConstructor": true,
    "properties": {
      "config": {
        "dashboards": [{
          "title": "Custom Dashboard",
          "widgetIds": [
            "app_starts", "map_events"
          ]
        }
        ]
      }
    }
  }
  ]
}
The name of the bundle is "dashboard_customDashboard", see also the links in app.json and bundles.json.
The component section defines a dashboard called "Custom Dashboard".
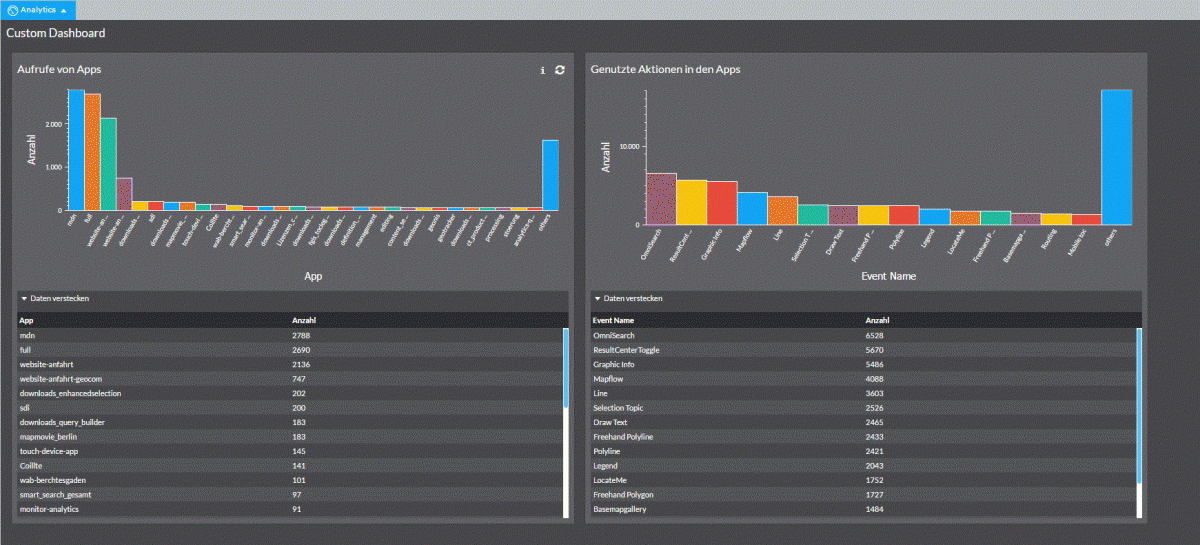
This uses the (global defined) widgets app_starts and map_events.
These widgets are defined in the bundle usagelog_defaultWidgets.
Checking the configuration
After saving the files, the dashboard can be tested. As expected, there are two widgets on the dashboard "Custom Dashboard".

Adding a new widget configuration
Following the same pattern, completely new widget (query) definitions can be published on your own dashboards.
To do this, open the file dashboard_customDashboard/manifest.json again by manually configuring the manager for editing.
For simplicity, the following code section contains the complete configuration of the bundle.
"config": {
  "dashboards": [
    {
      "title": "Custom Dashboard",
      "widgetIds": [
        "app_starts",
        "analytics_user_id"
      ]
    }
  ],
  "widgets": [
    {
      "widgetId": "analytics_user_id",
      "aggregation_query": {
        "refresh": true,
        "query": "tool_id:usagelog_dashboard_toggletool AND event_action:Activated AND _exists_:auth.user_id",
        "queryField": "auth.user_id.raw",
        "distinctValues": 20,
        "order": {
          "_count": "desc"
        }
      },
      "chart": {
        "title": "Aufrufe der Analytics-Dashboards",
        "subtitle": "Zeigt die Anzahl der Aufrufe der service.monitor Analytics Dashboards aggregiert auf authentifizierte Nutzer.",
        "type": "Columns",
        "openTableOnStartup": true
      }
    }
  ]
}
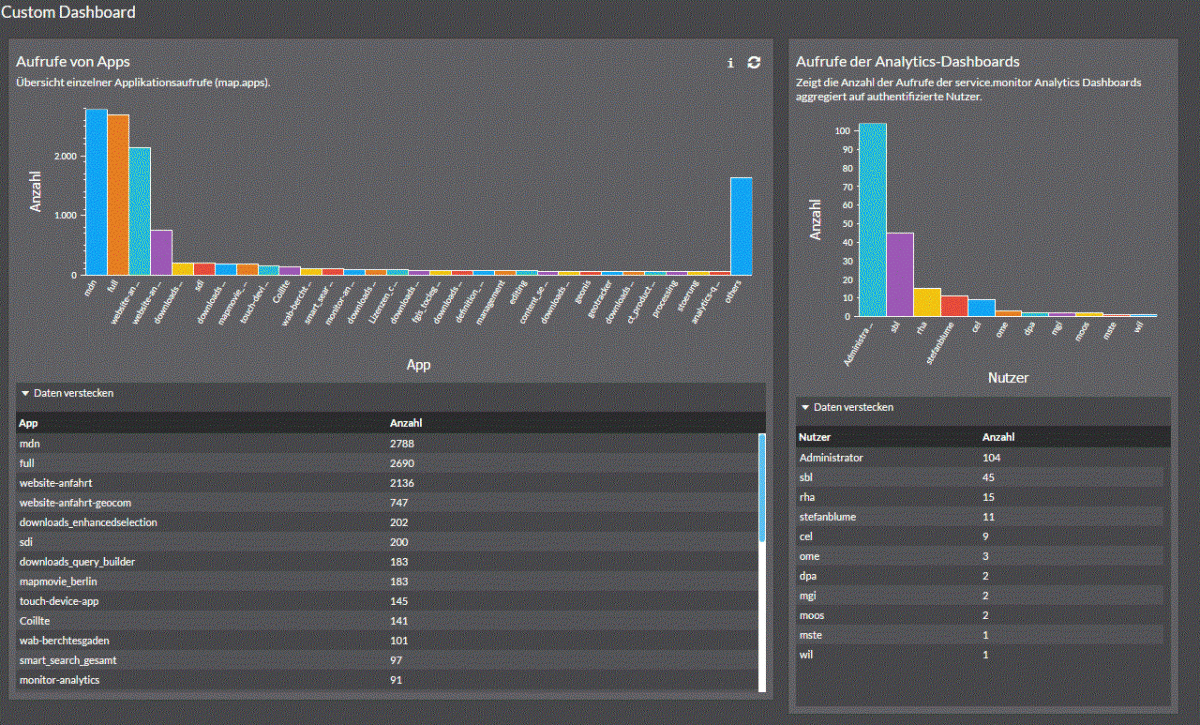
New is the widgets section, which defines a query against ElasticSearch.
It queries all tool activations of the Analytic Dashboards and aggregates the answers to the user_id.
The new widget is then referenced in the dashboards section.
