Usage data in con terra applications
Overview
service.monitor can be integrated into other con terra products to collect data about their usage. The following table shows which usage data can be collected in the products:
| Usage data collected | Location of data collection | Supported by |
|---|---|---|
- Basic HTTP request parameters (URL, protocol) - Basic HTTP response parameters (duration of request, HTTP status code) - Web browser used - Authentication information (e.g. user name) - IP address of the user (For more information, see sample data) |
Server-side through configuration of servlet filters |
security.manager, map.apps |
User interactions (for example, activating tools, see map.apps user interactions in dashboards) |
On the client side through JavaScript bundles in map.apps that communicate with the usage log REST interface of service.monitor |
map.apps |
This chapter describes the integration of service.monitor in map.apps and security.manager Enterprise Edition. To monitor usage data in other con terra products, ask for Support Plus or services for additional support. Many con terra products generally support the integration paths described here.
General procedure for the integration of service.monitor
-
Configuration of the ingest pipeline
ct-monitor-analyticsfor Elasticsearch -
Server-side configuration of map.apps and security.manager Enterprise Edition
-
Restarting the servlet container
-
Only for map.apps: Uploading the analytics bundles to the map.apps Manager and configuring the map.apps apps
-
Check Kibana Dashboards to see if usage data is being collected
Integration in security.manager Enterprise Edition
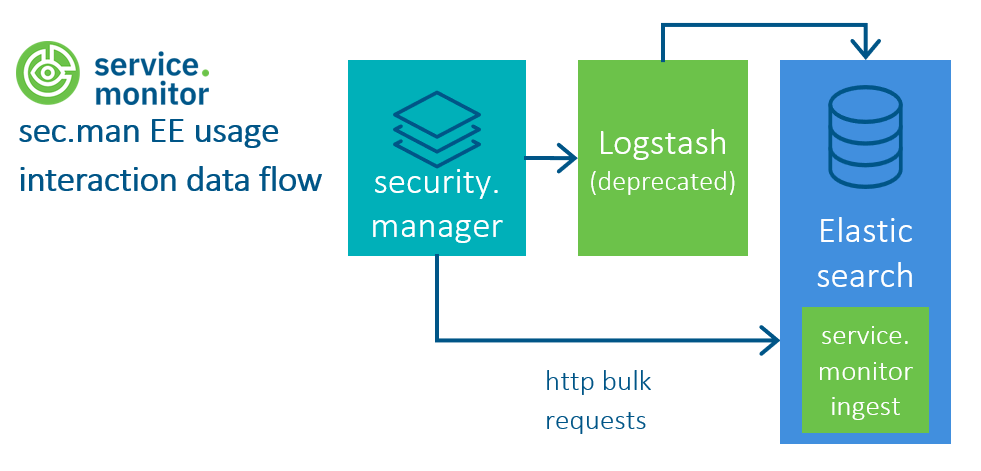
The following image shows a schematic representation of the integration of service.monitor in security.manager EE.

service.monitor is integrated in security.manager EE and sends the collected data directly to the ingest interface of Elasticsearch. The pipeline is configured within Elasticsearch and no other component is required. The data is processed further in the pipeline and can be written to an Elasticsearch index.
The data is transmitted via HTTP to the ingest pipeline ct-monitor-analytics.
| The integration described here is valid for security.manager versions 4.19 and higher. The integration for versions 4.15 - 4.18 can be found in the service.monitor documentation up to version 4.9.1. |
Installation and configuration steps for the WSS web app
Since security.manager 4.19, the service.monitor integration is part of security.manager (WSS webapp) and only needs to be activated or configured in the application.properties file.
Add the following configuration parameters in the file [SECURITY_MANAGER_DATA_FOLDER]/application.properties and adjust the values to your environment.
The servlet container must be restarted after the changes have been made.
Ingest-Pipeline
analytics.enabled=true
analytics.messengerType=elastic
analytics.elastic.url=https://elasticsearch.example.com
analytics.elastic.username=elastic
analytics.elastic.password=${secret.monitoring.elastic.password}
If analytics.messengerType is set to elastic, collected usage data is recognized in the servlet filter.
How it works: The ElasticsearchMessenger activated with the analytics.messengerType property sends the data to the analytics-usagelog-tool index of the Elasticsearch instance (analytics.elastic.url) by default. The ingest pipeline ct-monitor-analytics is activated by URL-Parameter. This can select the correct Elasticsearch index depending on the collected data and thus write data from other con-terra products (e.g. map.apps map interactions) to another index (e.g. analytics-usagelog-map).
|
Installation and configuration steps for the administration web app
The administration web app is installed in the same way as the WSS web app. In addition, the following steps must be carried out:
-
Copy the following files from the directory
[security.manager]/webapps/wss/WEB-INF/libto the directory[security.manager]/webapps/administration/WEB-INF/lib-
ct-monitor-analytics-message-extender-<version>.jar -
netty-*-<version>.Final.jar
-
-
Customize the file
[security.manager]/webapps/administration/WEB-INF/classes/spring-filter-config.xmlas follows:-
Insert the bean reference
<ref bean=“monitorAnalyticsFilter”/>after<ref bean=“webSecurityFilter”/>(about line 50) -
Insert the following section before the closing
</beans>element at the end of the file:<bean id="monitorAnalyticsFilter" factory-bean="monitorAnalyticsFilterFactory" factory-method="create"/> <bean id="monitorAnalyticsFilterFactory" class="de.conterra.usagelog.support.SecmanEEMonitorFilterFactory" destroy-method="close" p:enabled="${analytics.enabled}" p:messengerType="${analytics.messengerType}" p:elasticServerUrl="${analytics.elastic.url}" p:elasticUserName="${analytics.elastic.username}" p:elasticPassword="${analytics.elastic.password}" p:httpClientFactory-ref="httpClientFactory" />
-
The servlet container must be restarted after the change has been made.
Integration in map.apps

- INFO
-
At least map.apps version 4.18 is required for the integration described here. The procedure for integrating older map.apps versions can be found in the older service.monitor documentation (up to service.monitor version 4.9.1).
Installation and configuration steps as of map.apps version 4.18
Since map.apps 4.18, the service.monitor integration is part of map.apps and only needs to be activated/configured via application.properties.
Enter the following connection parameters in the file [MAPAPPS_DATA_FOLDER]/application.properties and adjust the values.
Then restart the servlet container (e.g. Tomcat).
Using the ingest pipeline
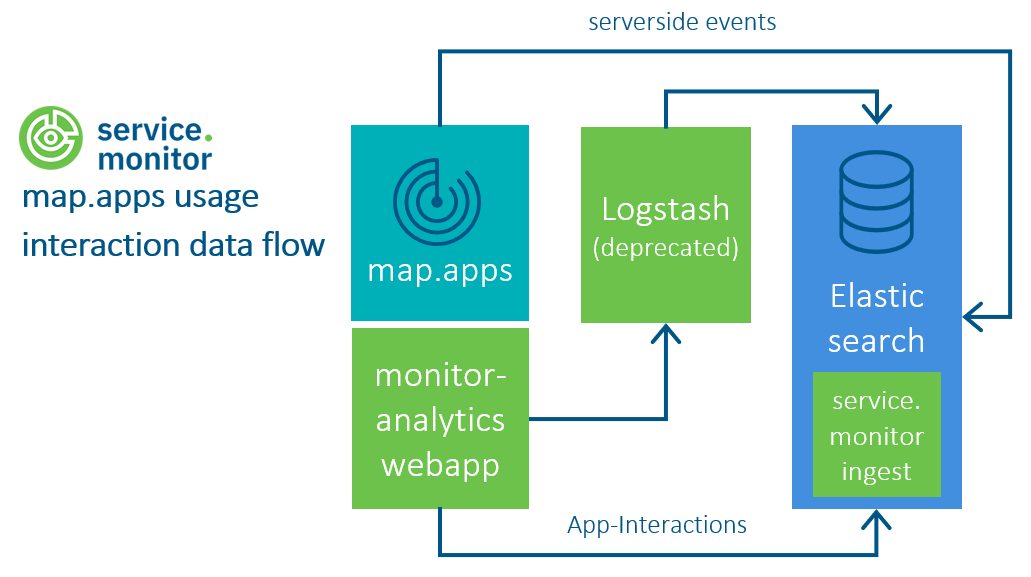
The ingest pipeline is configured in the same way as the ingest-pipeline configuration in security.manager EE. If analytics.messengerType is set to elastic, captured user interactions are sent from map.apps to the Usagelog REST endpoint.
Upload analytics bundles
To use the bundles provided by service.monitor to record user interactions in map.apps, install them in the map.apps Manager.
-
Log in to the map.apps Manager as user Admin.
-
Switch to the Bundles tab.
-
Click + Create and select the file
ct-monitor-analytics-js-[VERSION].jar.
Configuration of map.apps for recording user interactions in apps
In addition to uploading the bundles, you must add or change the properties listed below in the application.properties of map.apps.
Then restart the servlet container.
The value of the data.directory.location property is different from the corresponding property in service.monitor.
|
#### service.monitor Integration
analytics.service.url=/monitor-analytics/resources/usage/log
analytics.message.src=map.apps
appservice.default.bundles=analytics_restservice

servicemonitor.base.url=/monitor
analytics.management.role=maAdminanalytics.service.url-
HTTP endpoint for collecting usage data by the service.monitor UsageLog webapp.
Property status: neu
Default value:https://analytics-host.example.com/monitor-analytics/resources/usage/log analytics.message.src-
Name of the message source (for later analysis).
Property status: neu
Default value:map.apps appservice.default.bundles-
Bundles that are loaded for each app created.
If you add the
analytics_restservicebundle to the property, all apps send the collected data to the REST interface configured inanalytics.service.urlby default. This happens even if theanalytics_restservicebundle is not included in theallowedBundlessection of the app and thus simplifies the activation of service.monitor for all apps.If you edit and save an app via the live configuration in map.apps, the bundles listed here are added to
app.json. This change is retained even if bundles are removed from theappservice.default.bundleslist.This property is only applied for apps that are stored in the map.apps database and not for apps that are only stored in the file system.
Property status:
This property may already exist in the
application.propertiesfile
Default value:analytics_restservice(since map.apps 4.16)Default value:
system,templatelayout,analytics_restservice servicemonitor.base.url-
HTTP endpoint for calling the
/monitorwebapp within the map.apps management.Property status: neu
Default value:https://monitoring-host.example.com/monitor analytics.management.role-
Name of a role that is required to display the
/monitorwebapp in the map.apps Manager.Property status: neu
Default value:maAdmin
If map.apps and service.monitor are not operated on a shared host, add the corresponding host to the allowedProxyUrls in the map.apps application.properties file.
|
Activation of logging per app
To enable logging for a single app, add a bundle with the writer component (e.g. analytics_restservice) to the allowedBundles section in the app.json.
Use appservice.default.bundles to enable logging for all applications instead.
{
  “load": {
    “allowedBundles": [
      ...
      “analytics_restservice”
    ]
  }
  ...
}
Usage data collected on the server side
The following data is collected on the server side in both map.apps and security.manager:
useragent-
Browser and operating system information.
Example:
“user_agent": ”Mozilla/5.0 (Windows NT 6.1; WOW64; rv:41.0) Gecko/20100101 Firefox/41.0” client_ip-
Anonymized client IP address.
Example:
“client_ip": ”123.12.12.000” request-
Information on request parameters.
Example:
"request" : { "server_host": "secman-host.example.com", "url_query": "?queryProperty=testvalue", "server_context: "/wss", "referrer": "http://www.example.com", "protocol": "https" } auth-
Authentication information such as user name, user roles, etc.
Example:
"auth": { "authenticated": true, "user_id": "userA", "login_time": "2011-17-10 11:17:50", "group_name": "sampleGroup", "roles": [ "admin", "editor" ] } response-
Information on response parameters.
Example:
"response": { "status": 200 } response_time-
Response time in nanoseconds and response time in milliseconds.
Example:
"response_time": 12345678,
"response_time_ms": 1234.5678