Analytics
Dashboards
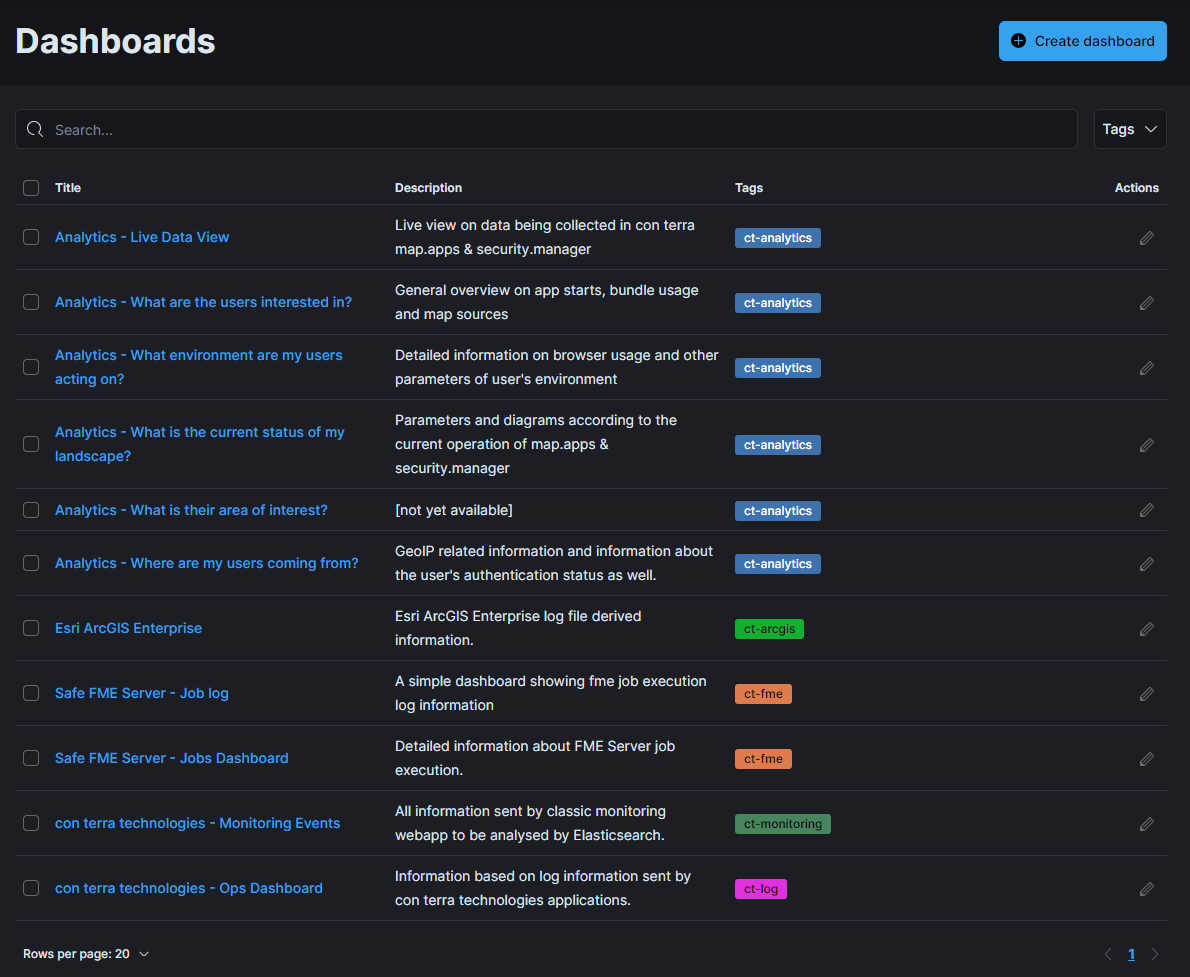
The dashboards of service.monitor are the central access point to the collected data. Dashboards are available for Elasticsearch Kibana.
Kibana dashboards span all the following data sources:
Data analysts are also capable of browsing the pure data on their own. Please see Discover view in Kibana.
Alert Rules
With the help of alerts, any events or content-related conditions of the data stored in Elasticsearch can be used to trigger notifications in service.monitor. The Kibana Alert Rules are used for this purpose. Their configuration here is described using practical examples.