map.apps user interactions
The dashboards on user interactions help to compare expectations of app usage with actual usage. This can happen at different levels. Management wants to obtain figures on the specific demand for individual applications in order to measure overall success. People who define the content of the applications want to know which map or search services are frequently used. The app developers can understand what the user’s device landscape looks like and receive information if there are particularly many errors in individual apps. Based on this information, all those responsible can make decisions that improve the service offering as a whole.
| This page only shows a selection of available analyses and diagrams of the map.apps dashboards. |
Dashboard "Analytics - What are the users interested in?"
General information about
-
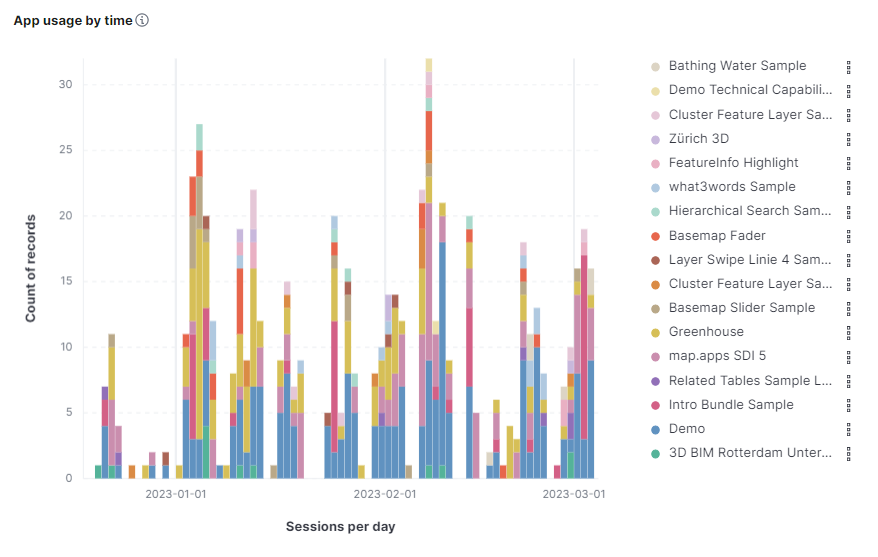
the launch of map.apps apps
-
the temporal distribution of applications
-
tool usage in the apps
-
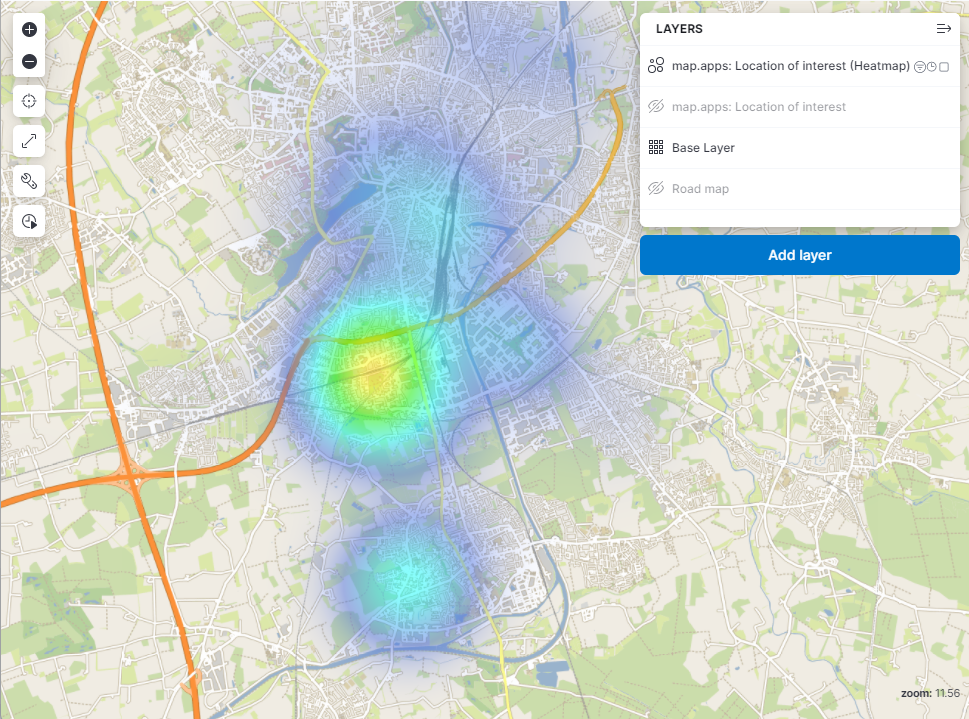
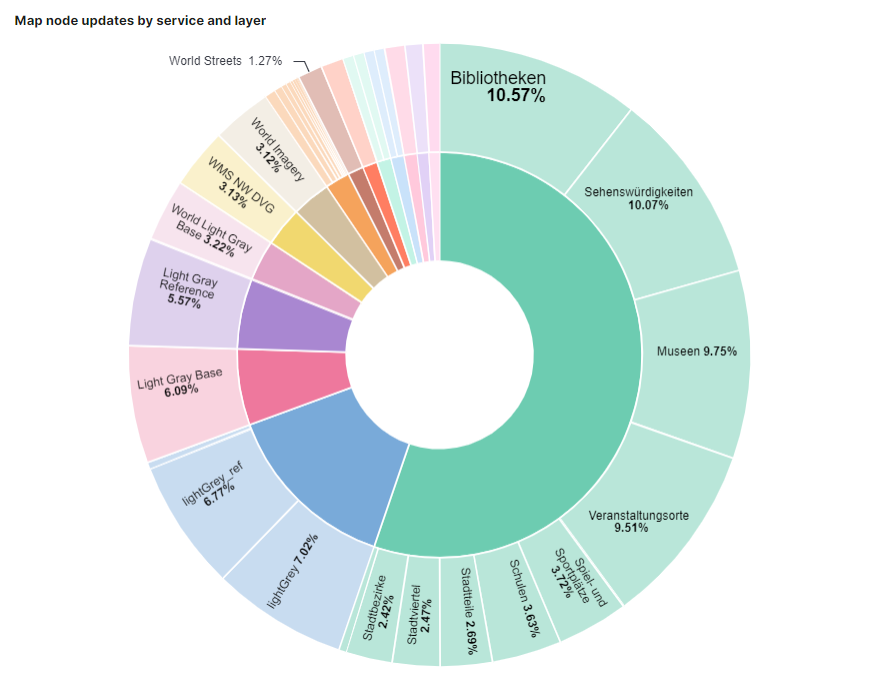
the general use of map content
-
map interactions with ArcGIS Online
-
Use of Omnisearch and search slot
Statistical data on the frequency with which an application is started is a fundamental value for assessing the success of a service offering. When are which apps used, what is the medium-term development of access figures and can a connection be established between the relaunch of an app and this development? With the data from service.monitor, you will be able to make well-founded decisions for the future.
The actual use of map services or the deviation from expectations can be an indication of potential for change in order to be able to offer users a better tailored service.
Dashboard "Analytics - What environment are my users acting on?"
The dashboard provides basic web analytics information about the user’s device landscape:
-
Browser
-
End devices
-
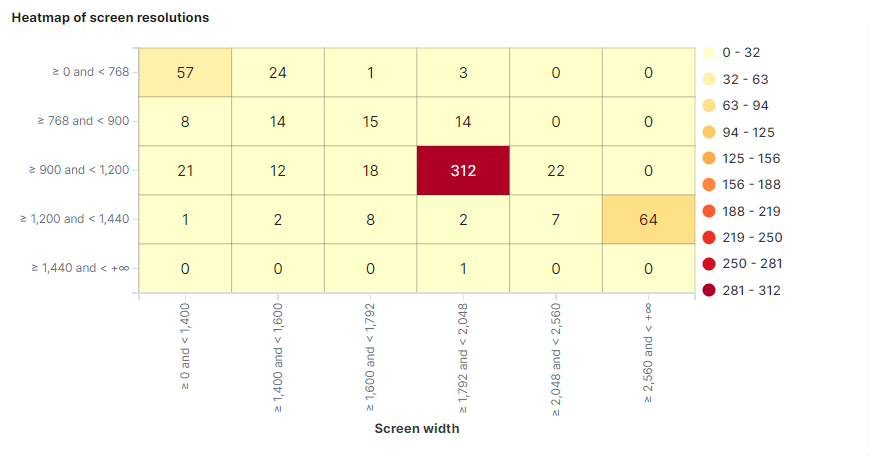
Viewport
Of particular interest is the option of using a heat map to graphically understand which screen resolutions are being used by users. Use filters to take into account the difference between mobile and desktop devices.
Dashboard "Analytics - What is the current status of my landscape?"
The dashboard presents operational information, especially in the context of Javascript console messages and their distribution to browsers and apps.