ArcGIS Enterprise dashboards
The ArcGIS Dashboard gives a current and historical overview of the ArcGIS Enterprise system environment.
Dashboard "Esri ArcGIS Enterprise usage information"
Dashboard "Esri ArcGIS Enterprise operational data"
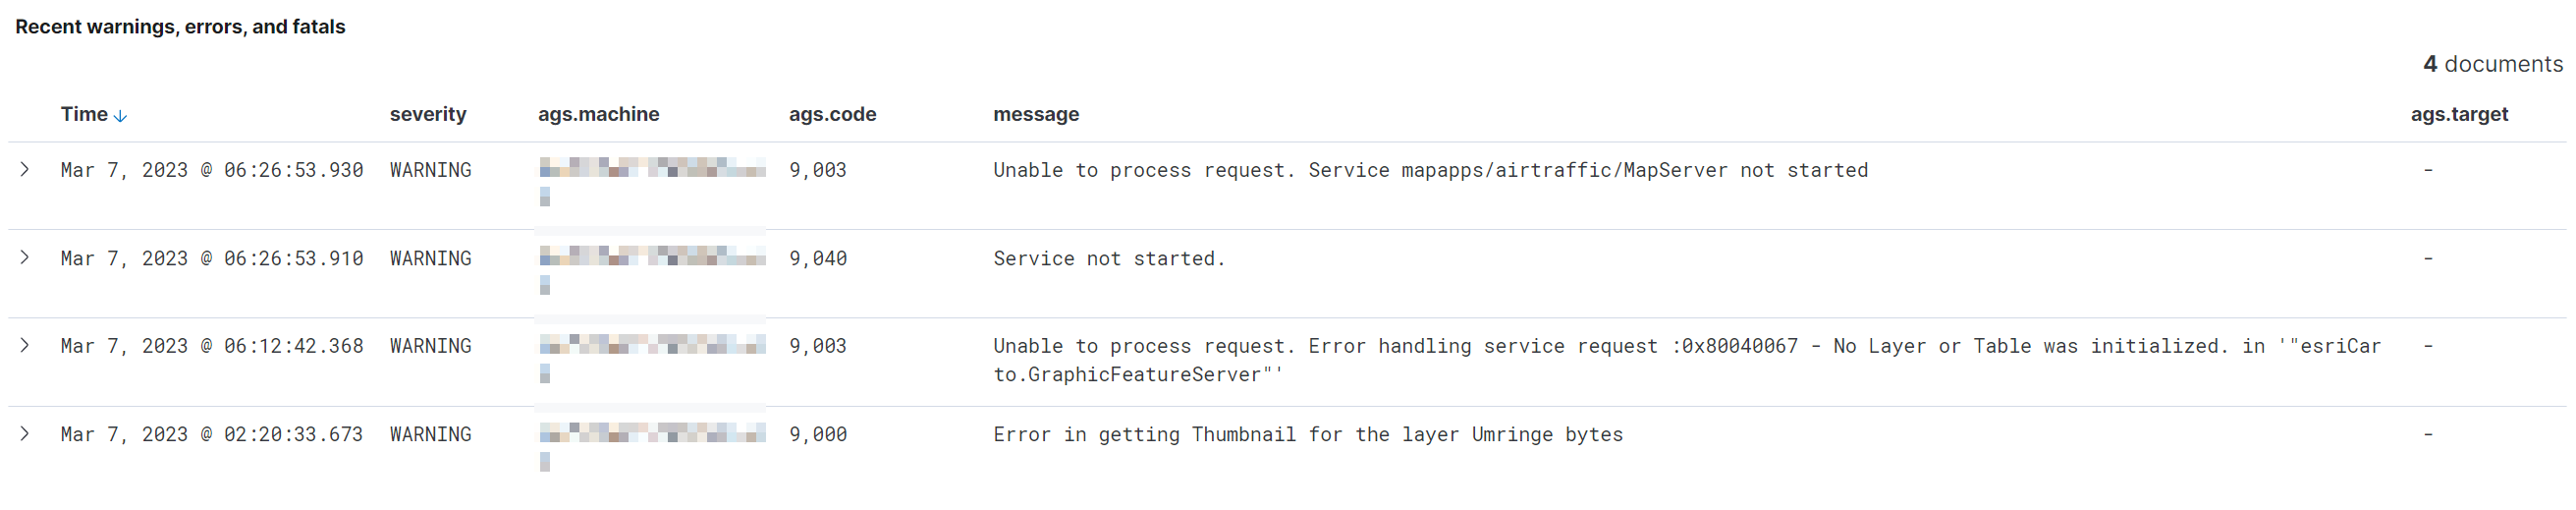
Current errors and warnings
The table of current warnings and errors shows problems with individual services but also general problems in ArcGIS Server or ArcGIS Enterprise Portal, which must be reacted to as quickly as possible.
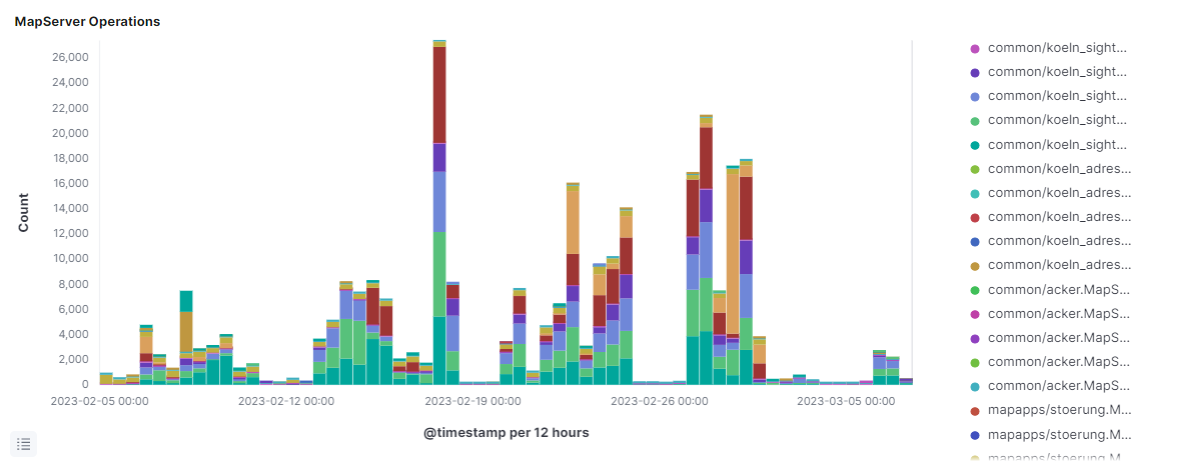
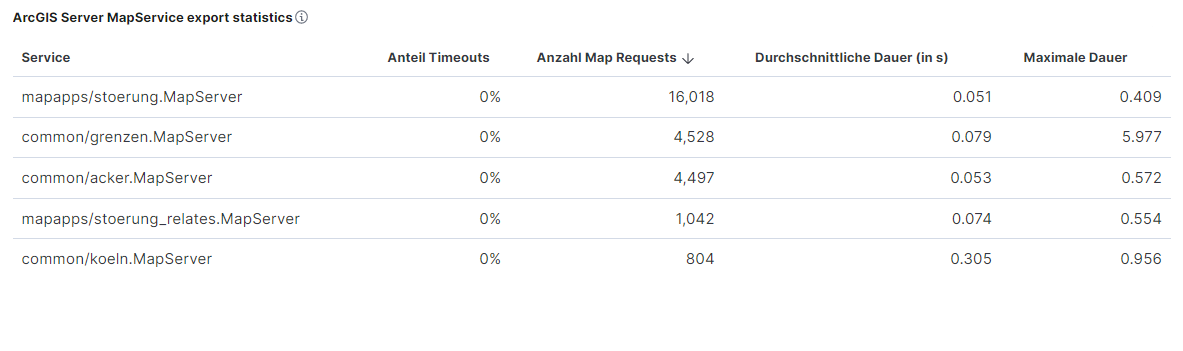
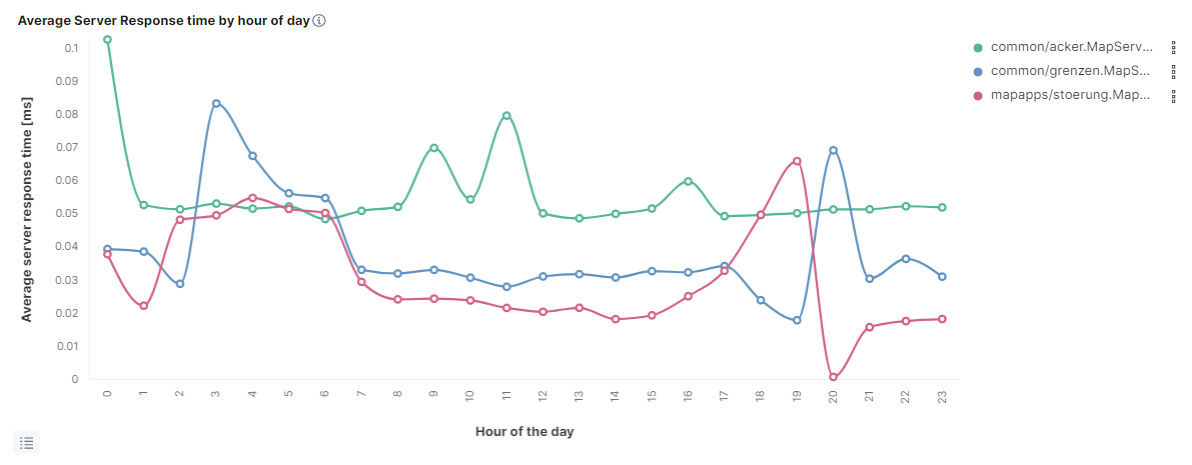
The dashboard also provides information about the amount of log data processed and which ArcGIS operations are used.
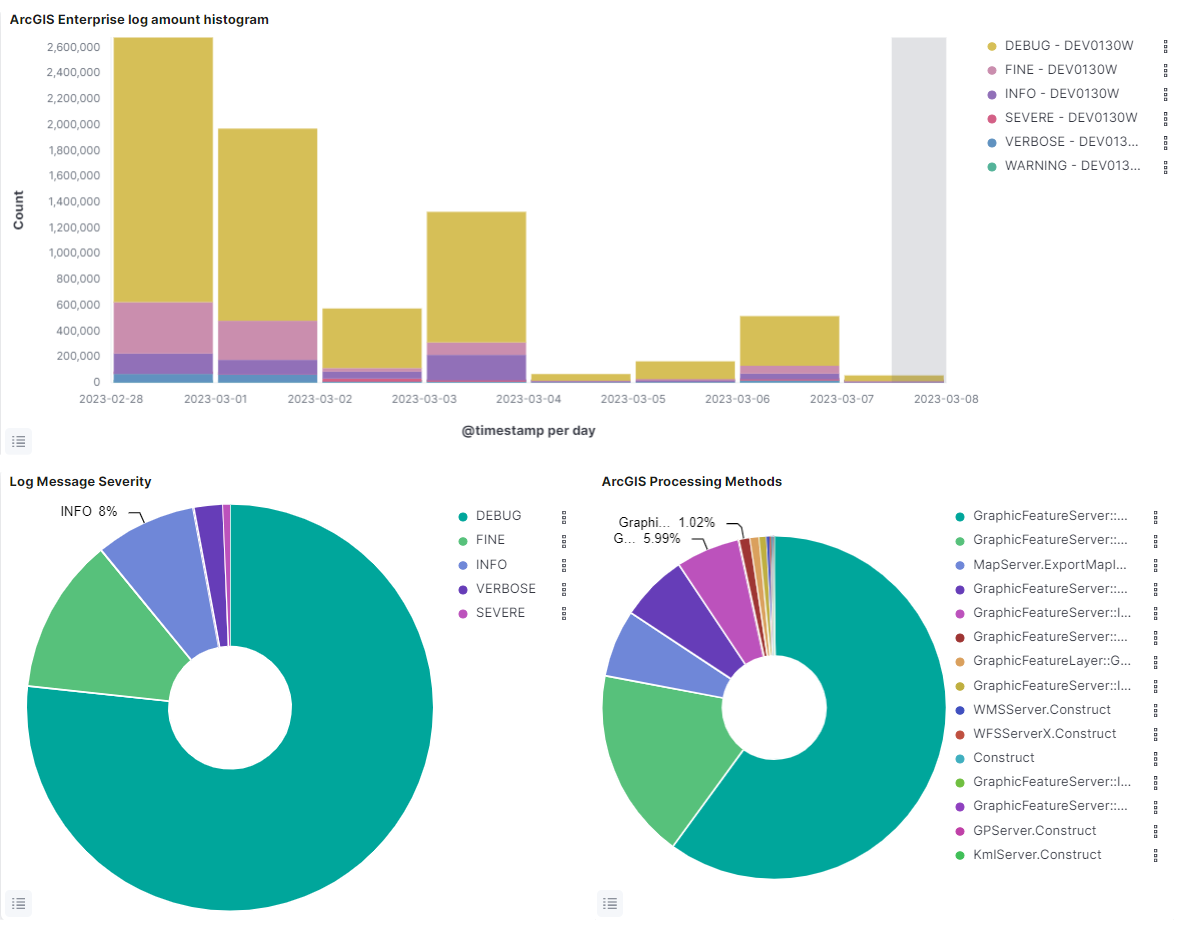
| This page presents only a selection of the analyses and charts available on this dashboard. |