Monitoring events
Overview
Details about service.monitor Monitoring executed monitoring executions can be stored in the local database.
Alternatively they can also be sent to elastisearch via http (recommended)
Local Database Storage
Events are stored in the service.monitor database, no further configuration is required.
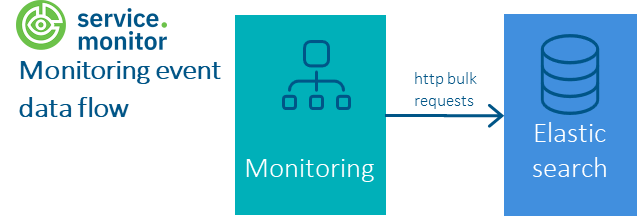
Elasticsearch Storage
Events are sent directly to Elasticsearch and processed through the ct-monitoring-events ingest pipeline.
Send events to Elasticsearch using HTTP
#### Storing monitored events directly in Elasticsearch ####
event.storage.elastic.http.enabled=true
event.storage.elastic.index.name=ct-monitoring
event.storage.elastic.buffer.size=5
monitoring.elastic.url=http://localhost:9200
monitoring.elastic.username=elastic
monitoring.elastic.password=<password>
The above configuration assumes that the Elastic process is running on the same machine as the Tomcat.