Service & Job Management
The Service & Job Management page contains an overview of all services and jobs being monitored at the moment.
Critical jobs
This section displays the jobs that are currently in a critical state. A click on the job name highlights the job in the table accordingly.

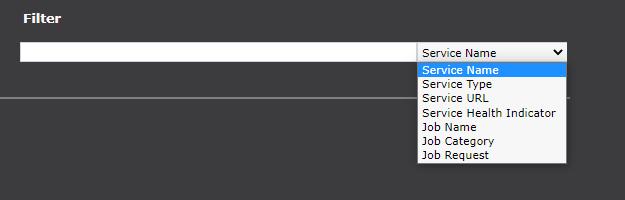
Filter
This section offers you the possibility to filter the list of services according to certain criteria. The following attributes can be selected via the selection box:
-
Service name
-
Service type
-
Service URL
-
Service availability
-
Job name
-
Job category
-
Job request
Press Esc to reset the filter and show all services again.
|
Menu
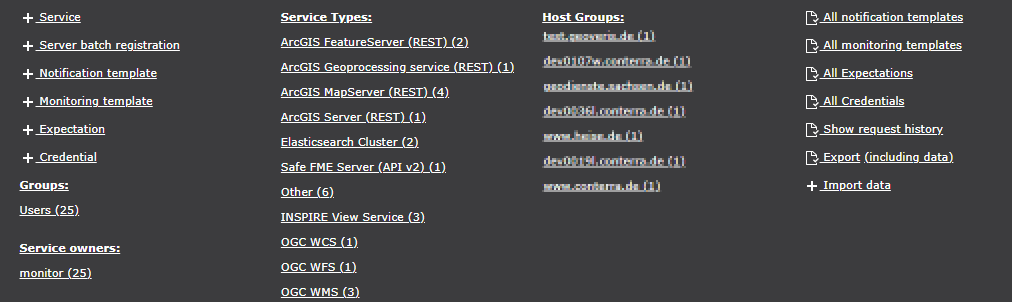
The menu section comprises several entries:
 Service
-
Register a new service to be monitored by the application.
- Server batch registration
-
Provide an map.apps app or ArcGIS for Server REST Url to completely monitor an instance.
- Notification template
-
Create a new Notification template defining how, when and on what channels you like to be notified.
- Monitoring template
-
Create a new Monitoring template defining when and how often services shall be monitored.
- Expectation
-
Create a new Expectation template for checking specific conditions in monitored service responses.
- Credential
-
Create a new Credential template for accessing services that require authentication.
- Service type
-
Show Service and jobs filtered by their type. A click onto a host filters the current view to that host group.
- Host Groups
-
A comprehensive overview about all host being targeted by monitoring. A click onto a host filters the current view to that host group.
 User Management
-
Opens the security.manager to work with the user management. This option is only visible to users owning the role
sM_Administrator.  All notification templates
-
Gives you access to all available notification templates.
- All monitoring templates
-
Gives you access to all available monitoring templates.
- All expectations
-
Gives you access to all available expectation templates.
- All credentials
-
Gives you access to all available credential templates.
- Show request history
-
Gives you access to list of all request sent by service.monitor.
- Export (including data)
-
Creates an export of all services and templates. A click on including data also exports the collected monitoring data.
- Data import
-
Import of services, templates and data.
| You can register services only if you have created at least one fitting notification template and one monitoring template. Otherwise, this option is not available. |
Server Batch registration
Batch registration is a convenient way to automatically create new monitoring services. This can be done on the basis of a map.apps or ArcGIS Server instance.
- ArGIS Server
-
-
map and feature services can be derived from an ArcGIS Server for monitoring.
-
Please provide an ArcGIS Server Catalog REST URL, i.e.
http://www.example.com/arcgis/rest/services.
-
- map.apps
-
-
Please provide an url to the apps folder, i.e.
http://www.example.com/mapapps/resources/apps
-
- security.manager Enforcement Points
-
-
Please provide an url to administration webapp, i.e.
http://www.example.com/administration. If both products are not operated on the same host, it is necessary to allow access to the REST service, see configuration valuesecurity.allowed.hostnamesin security.manager. -
Please also specify the templates to be used for notifications and monitoring.
-
The checkbox allows the specification about sending notifications about the creation of each individual job.
-
Data export and import
The data export/import is primarily used to transfer services and their collected data from one monitor instance to another. Please note that all objects — monitoring, notification templates as well as services and jobs, but also export data — are exported with their IDs and must not already exist in the database when imported. The existence of duplicate IDs is checked by service.monitor before the import.
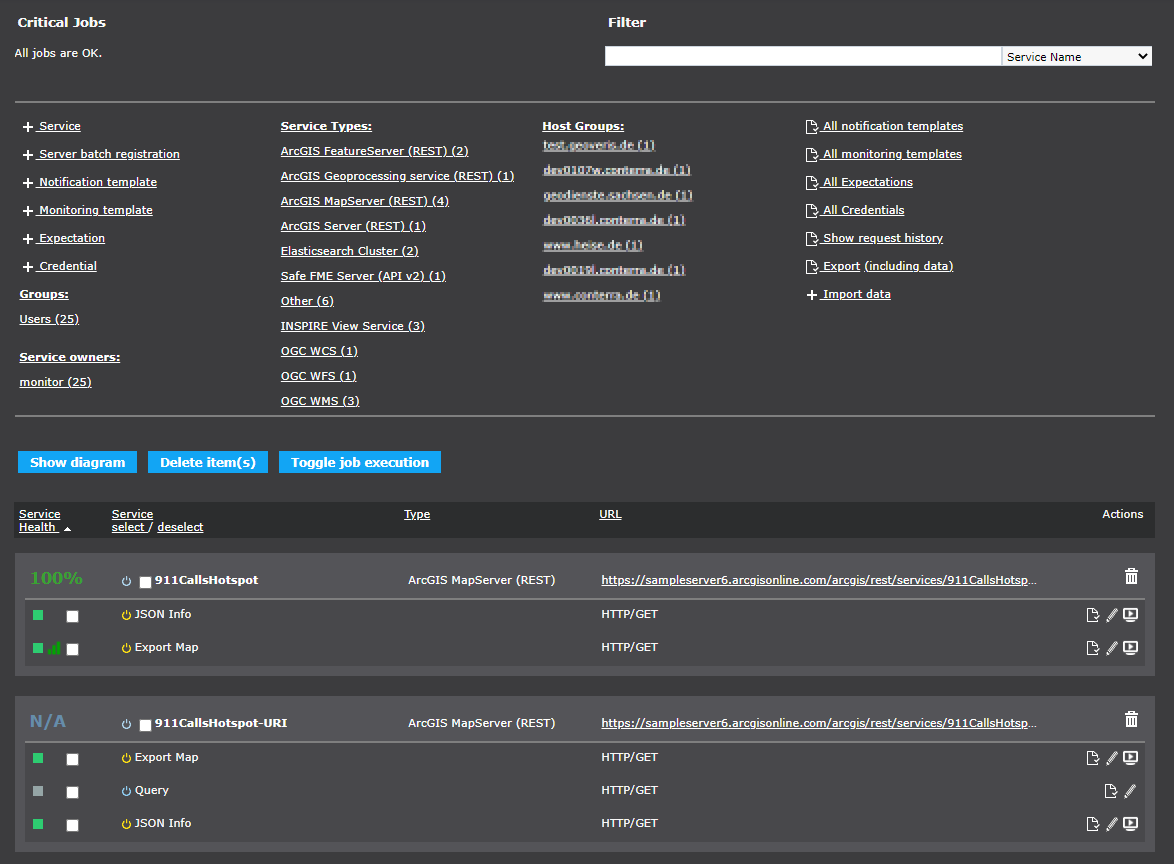
Service & Job List
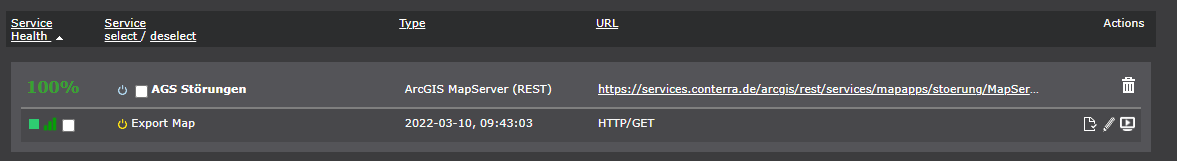
This is the main area of service.monitor. The services visible to the user and their associated jobs are displayed here. All the important attributes of the service and job, as well as the central functions for administration, are made available here:
| Section | Features | Description | ||
|---|---|---|---|---|
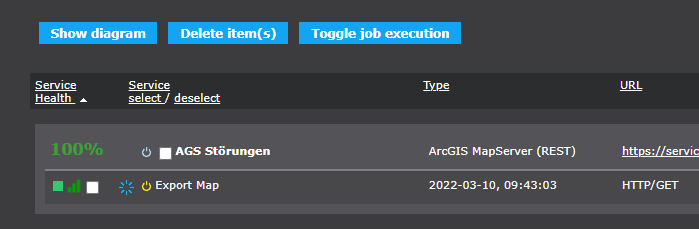
Service health |
percentage value |
A percentage value displaying the actual health state of the service.
|
||
|
The status of a service job being monitored is displayed using a traffic light system.
|
|||
|
Wobbler indicating latest monitoring activity. |
|||
|
Button to toggle monitoring activity on all jobs of this service. |
|||
|
Enable this check box to mark this job for further actions. |
|||
Service |
Service name |
The service name is displayed on top of each row. |
||
|
Button to toggle monitoring activity on this job. |
|||
|
Enable this check box to mark this service for further actions. |
|||
Job name |
The single job names belonging to a service are listed below the service name. |
|||
Type |
Service type |
The type of the service being monitored, e.g. ElasticSearch Cluster. |
||
Job category |
The job category that has been selected for each job. |
|||
URL |
Service URL |
The base URL of the service instance. |
||
Query string |
The HTTP GET query string that is sent along with the job request. |
|||
Actions |
|
Deletes the service entirely, along with any associated job. |
||
|
Opens the job’s detail page. |
|||
|
Open the job’s edit page. The edit page also allows to edit the according service as well. |
|||
|
Immediately triggers the execution of a job. |
|
Sorting & hyperlinks
You can sort any column of the content section in ascending or descending order by clicking on the head labels Availability, Service, Type, URL. You can also click the service URL or a job’s HTTP GET request to open up a new browser window following that URL or request. |