Dashboards
service.monitor dashboards for Elasticsearch Kibana are available as JSON files in the folder analytics/elasticsearch.
The files contain all configuration for the necessary objects in Kibana:
-
index pattern
-
queries
-
visualizations
-
dashboards
Procedure
-
Open Kibana and switch to the menu item Management > Stack Management.
-
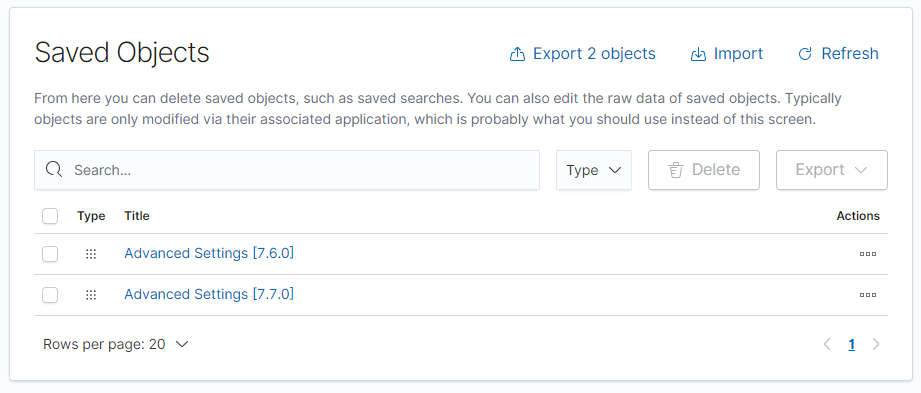
Navigate to section Kibana > Saved Objects.
-
Locate and import the JSON file via the import dialog.
-
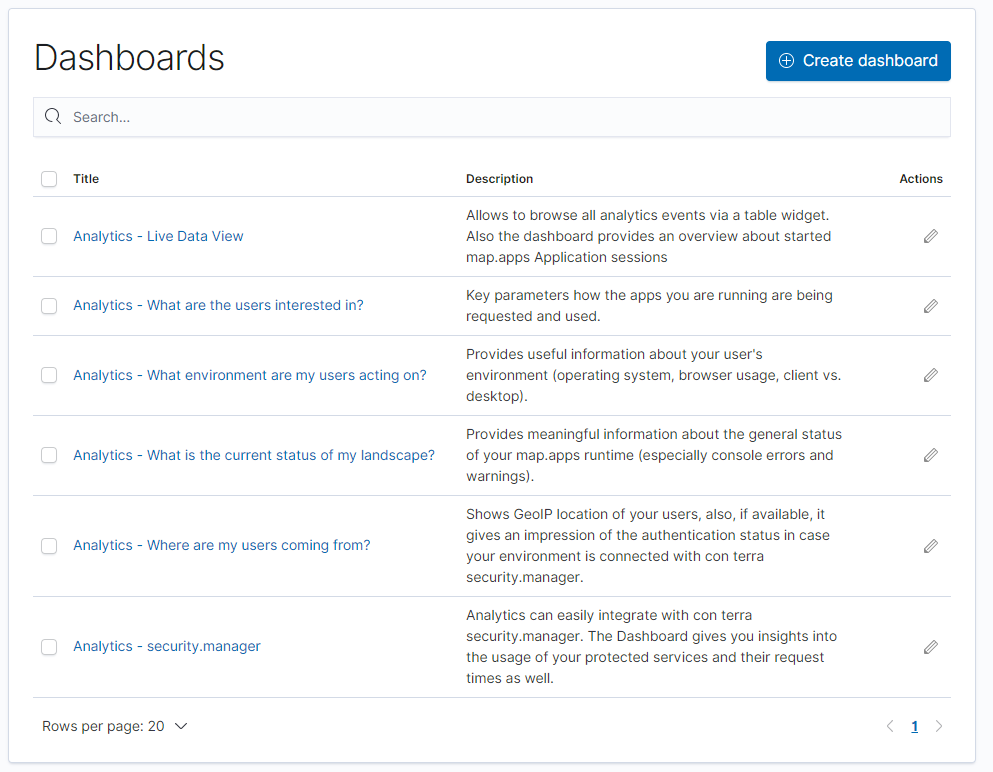
Click Dashboard in the left menu to view the imported dashboards.
| The dashboards can only be imported successfully in Kibana 9.1.x. |