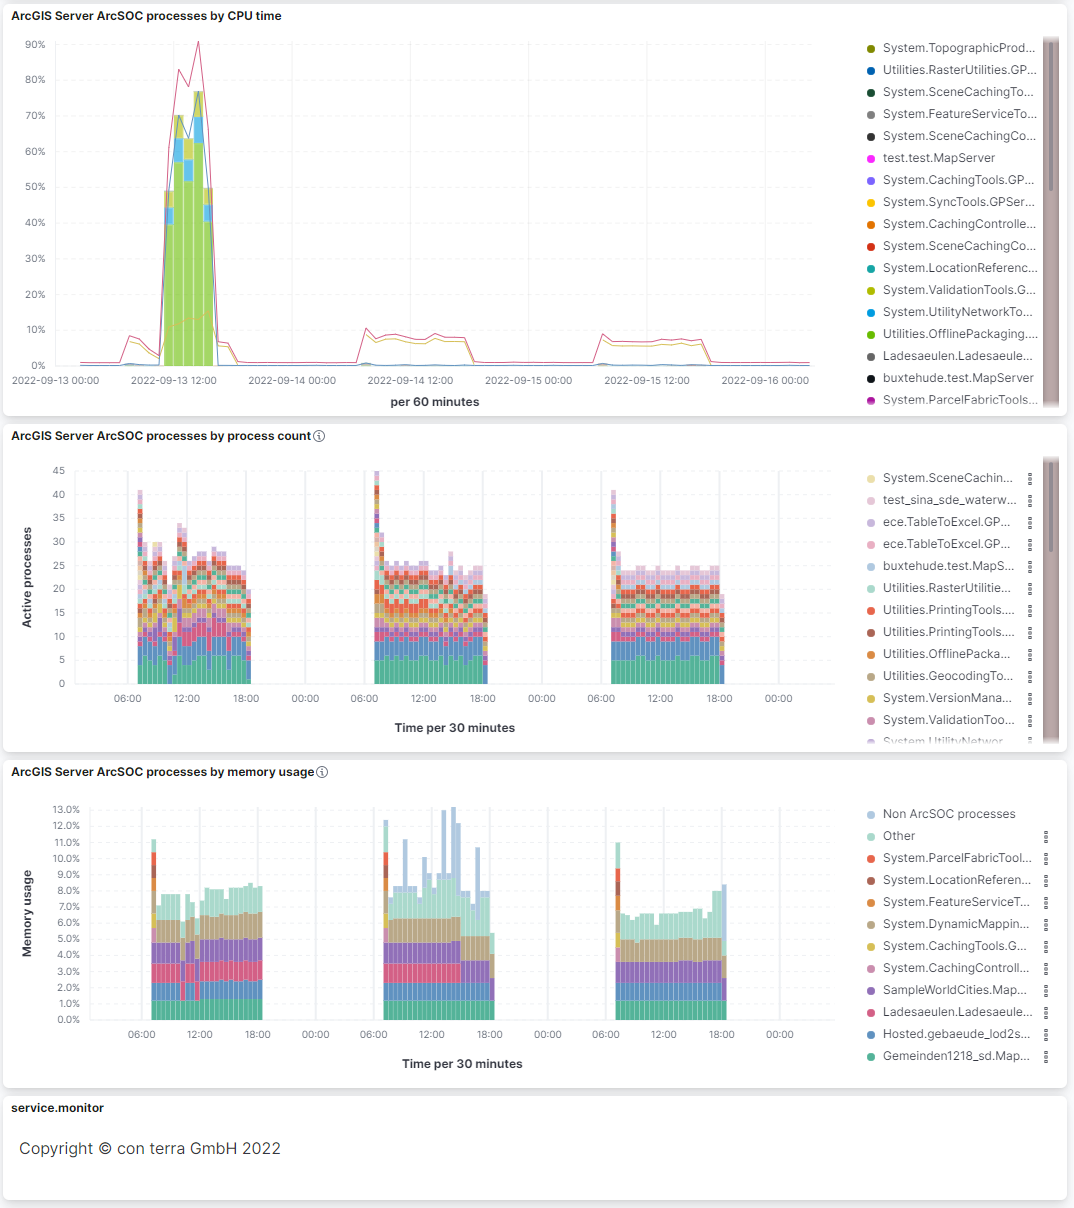
ArcGIS Enterprise ArcSOC process analysis
To understand the historical and current workload of the ArcGIS Server infrastructure, the ArcSOC dashboard offers data for analysis based on concrete system metrics of the respective hosts. The following analyses are provided:
-
View of the "CPU Time" of the hosts; absolute and split over the individual ArcGIS ArcSOC processes.
-
Simple summation of the ArcSOC process count
-
Memory consumption of the ArcSOC processes
| In the screenshot below you can see an ArcGIS Server instance over three days. Obviously the server is only in operation during the day, as the night hours are not analysed in the diagrams. The first diagram shows a high CPU load on the first day, on the following days the server is almost not used at all. |