Migration of legacy data from Elastic 1.7
With the version change from service.monitor 4.3 to 4.4, a major version jump was made in the basic technology Elasticsearch used in Analytics. The table below shows that Elastic was updated from version 1 to version 7.
Overview of the versions
| service.monitor | Elasticsearch |
|---|---|
|
|
|
|
|
|
|
|
Positive aspects of this change are the many functional enhancements, better performance, stability and maintainability, as well as the return to an actively maintained software cycle on the part of Elasticsearch. However, due to the big jump, standard upgrade paths are not available in the Elasticsearch stack. Existing customers will have to answer the question of how to deal with the existing legacy indexes.
This article therefore describes a simple migration path and gives tips on how the operation of the Elasticsearch cluster can be continued as seamlessly as possible.
Migration through re-indexation
Simply put, the solution to the migration issue is to run two Elasticsearch instances for a short period of time and migrate the legacy indexes by reindexing the dataset triggered by the new system. Reindexing means querying index data (e.g. usage activities in map.apps) and re-storing each event in a new (different) Elasticsearch index.
An ideal typical procedure for updating service.monitor (on a host) would look like this:
-
Installation of the new Elasticsearch cluster (version 7.x)
-
Updating the monitor-analytics web application
-
Updating the map.apps bundles for service.monitor Analytics
-
Stopping the old Elasticsearch cluster (version 1.7.x)
-
Commissioning of the new cluster (events are already logged)
-
Reconfiguration and restart of the old cluster (port change)
-
Performing the re-indexation
-
Stop / uninstall the old Elasticsearch cluster
| Individually, the best procedure may differ from the one described here, just as the values for ports and index names are only chosen as examples. |
Commissioning of the new cluster
In the course of commissioning the new cluster, a configuration setting can be set that is important for successful reindexing.
To do this, add the value reindex.remote.whitelist to the elasticsearch.yml file in the conf folder of the installation.
The additional line then contains a list of Elasticsearch clusters that should be able to be queried and looks like:
reindex.remote.whitelist: ["localhost:9201", "127.0.0.1:9201", "host.example.com:9201"]In this case, the old cluster is in version 1.7.x.
Reconfiguration of the old cluster
Since the re-indexing is done via the HTTP protocol and both clusters are operated in parallel, the old cluster must be reconfigured so that it listens to other ports.
This is achieved by adapting the file <install>\conf\elasticsearch\elasticsearch-analytics.yml.
Change or add the two values to the configuration:
http.port: 9201
transport.tcp.port: 9400
The value for http.port defines the port via which Elastic can be reached via HTTP.
The other value is used for internal communication in a cluster.
It is important that it differs from the default value 9300 of the new cluster.
Performing the re-indexation
Reindexing is most easily done with the help of the Dev Tools from Kibana.
To do this, open Kibana and navigate to Management > Dev Tools. In the Dev Tools console, HTTP Elasticsearch API commands can be easily sent.
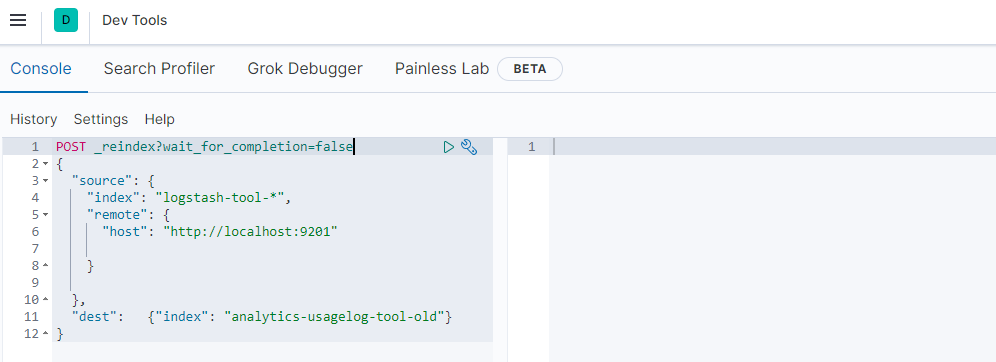
By sending several commands, you can now start reading the indices from the old system and writing them to new target indices.
In the following example, all data from the old system under port 9201, from all indices beginning with logstash-tool-, are reindexed into a new index with the name analytics-usagelog-tool-old on the new system.
POST _reindex?wait_for_completion=false
{
"source": {
"index": "logstash-tool-*",
"remote": {
"host": "http://localhost:9201"

    }

  },
  "dest":   {"index": "analytics-usagelog-tool-old"}
}
Calling the above command returns a task ID. The current status of the migration can be queried via the ID:
GET _tasks/<ID>On the old system, the following indices/index patterns can be considered for migration (depending on your individual mode of operation):
| Old index(pattern) | New index |
|---|---|
|
|
|
|
|
|
|
|
|
|
|
|
The command shown above must therefore be executed several times in modified form. The Reindex API is documented in more detail hier .
| The concrete mapping of old indices into new ones depends on both the stock index structure on the old system and the desired target index structure. Depending on the amount of data, it may make sense to divide the data into several indexes. An index should not exceed the size of 20 GB of hard disk space. |
Stop and uninstall the old Elasticsearch cluster
After a successful re-indexing, the old cluster can be stopped and uninstalled. If necessary, transfer the Elasticsearch index files from the file system to a long-term archive so that a backup of the old data stock can be used again.
| We will be happy to support you in the context of a consultation on the questions and in the implementation of the migration. Please contact us! |