Installation on Windows OS
Unlike previous service.monitor Analytics versions, the binary packages of Elasticsearch and Logstash are no longer part of this distribution and must be downloaded from elastic.co . Supported are the versions 7.11.x and 7.12.x, which have been tested explicitly. Compatibility with all 7.6+ versions can be assumed.
Installation documentation(Elasticsearch)
Please also get an understanding of installation by reading the according Elasticsearch documentation.
-
Installation of Logstash: https://www.elastic.co/guide/en/logstash/current/installing-logstash.html
-
Installation of Elasticsearch: https://www.elastic.co/guide/en/elasticsearch/reference/7.10/install-elasticsearch.html
-
Installation of Kibana: https://www.elastic.co/guide/en/kibana/current/install.html
Elasticsearch
After you have unpacked the download package, you can create a Windows service via bin/elasticsearch-service.bat
By default, Elasticsearch is available at http://localhost:9200/.
| Elasticsearch normally uses port 9200, please check if access to this port from outside is allowed by your firewall! Usually only the service.monitor Analytics Usage Log Webapp (see below) should be able to access Elastisearch. Exposing this port in the entire infrastructure represents a possible security risk. |
Configuration
In addition, you can follow these steps to make your cluster fully functional.
An elasticsearch.yml configuration file can contain this additional information:
# enabling security is recommended and desired
xpack.security.enabled: true
# this also comprises ssl transport security
xpack.security.transport.ssl.enabled: true
# you may define your own elasticsearch cluster name
cluster.name: <company>-operations
# each node participating in the cluster may receive an individual node name
node.name: analytics-node-01
# define network binding of elasticsearch, defaults to localhost, which is not sufficient if you distribute components across different nodes
# example here: your host is named "elastic.ops.company-vnet.de"
network.host: "elastic.ops.company-vnet.de"
# some settings quite specific to the number of nodes participating in your elasticsearch cluster
# if there is only a single node in your cluster, stay with the default "single-node"
# please verify w/ elastic docs: https://www.elastic.co/guide/en/elasticsearch/reference/7.17/bootstrap-checks.html
discovery.type: "single-node"
#discovery.seed_hosts: ["elastic.ops.company-vnet.de"]
#cluster.initial_master_nodes: ["elastic.ops.company-vnet.de"]
At [CD-CONTENTS]/software/analytics/elasticsearch/elasticsearch/elasticsearch-analytics.yml you will find some configuration parameters that are suitable for the operation of an Elasticsearch cluster.
Enabling Transport Layer Security (TLS) in the Elastic Stack & automatic password generation for the built-in accounts.
Running elasticsearch in production mode requires Transport Layer Security to be enabled. Elastic comes with some scripts to help set up this mode.
# generate new certificate authority
/usr/share/elasticsearch/bin/elasticsearch-certutil ca
# generates X.509 certificates and private keys
/usr/share/elasticsearch/bin/elasticsearch-certutil cert --ca elastic-stack-ca.p12
# auto create passwords for the built-in user accounts (--> xpack.security.enabled)
/usr/share/elasticsearch/bin/elasticsearch-setup-passwords auto
Please also see the Information from Elastic on TLS .
Logstash
After unpacking the download package, it makes sense to create a Windows service that can start the process automatically, independent of logged in users.
The best way to do this is to use the tool NSSM and copy it into the bin folder.
Calling it from an administrative command line calls the NSSM GUI, which can be used to define further properties of the service execution.
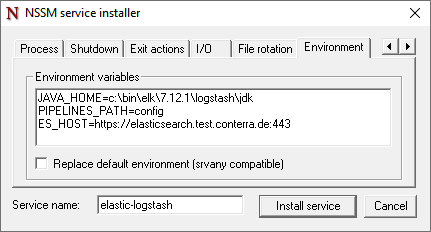
.\bin\nssm.exe install elastic-logstashDer Application path wird auf die logstash-bat der konkreten Version gesetzt.
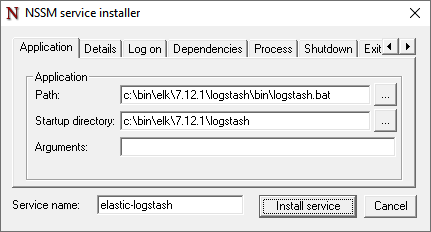
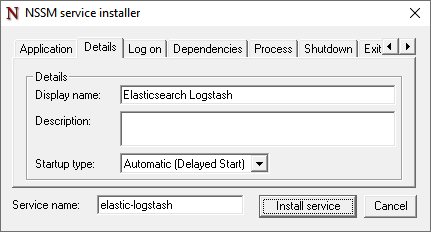
If required, a nice display name can be assigned.
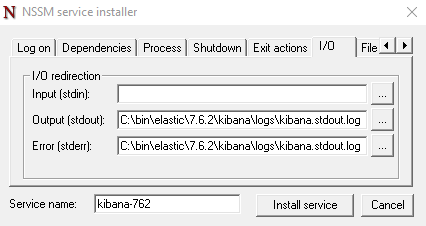
Console output is best redirected to files.
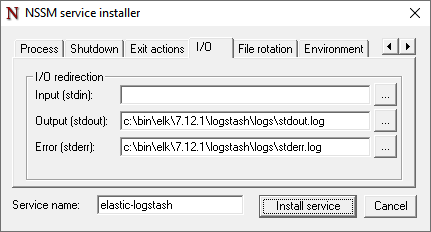
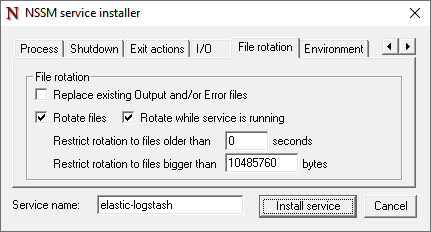
A log file rotation can be defined for these files. The value 10485760 bytes corresponds to 10 MBytes.
Since the logstash pipelines of service.monitor get values from environment variables, these can be set in the Environment section.
Kibana
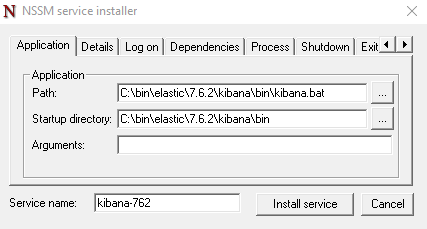
The creation of the Windows service for Kibana is done in the same way as for Logstash.
.\bin\nssm.exe install elastic-kibanaThe two screenshots show possible configuration options for the Windows service settings.
| The entries of NSSM can be found in the Windows Registry under the key 'HKEY_LOCAL_MACHINE\SYSTEM\ControlSet001\Services\'. |