Introduction
Operational, analytic and monitoring data for geo-apps and services
The operation of a successful and comprehensive geoIT solution is composed of different aspects. Besides obvious issues of general system stability and stable (map) services with speedy response times, a clear transparency of the activities of all geo-specific architecture components is also part of it. Furthermore, the success of a digital service offering is linked to intuitive usability, which usually cannot be achieved ad hoc, but rather by means of several improvement cycles based on good data on actual user interactions.
The service.monitor creates the transparency necessary for this by continuously recording and analysing operating data, log files, the quality of services as well as user interactions. Its results provide the necessary information for the targeted ongoing optimisation of your geoIT solution.
Analytics - successfully operate and improve geoIT solutions through operational data and user behaviour.
Thanks to the analytics capabilities of service.monitor, providers of geo-services are able to quickly and comprehensively analyse the operation and usage of their applications. Modern web analytics methods of the component optimised for map.apps provide insight into the concrete behaviour of users, continuously, automatically and in compliance with data protection regulations. Furthermore, many software products and components involved in a geoIT solution can provide their information for a comprehensive, integrating analysis.
System and operational data
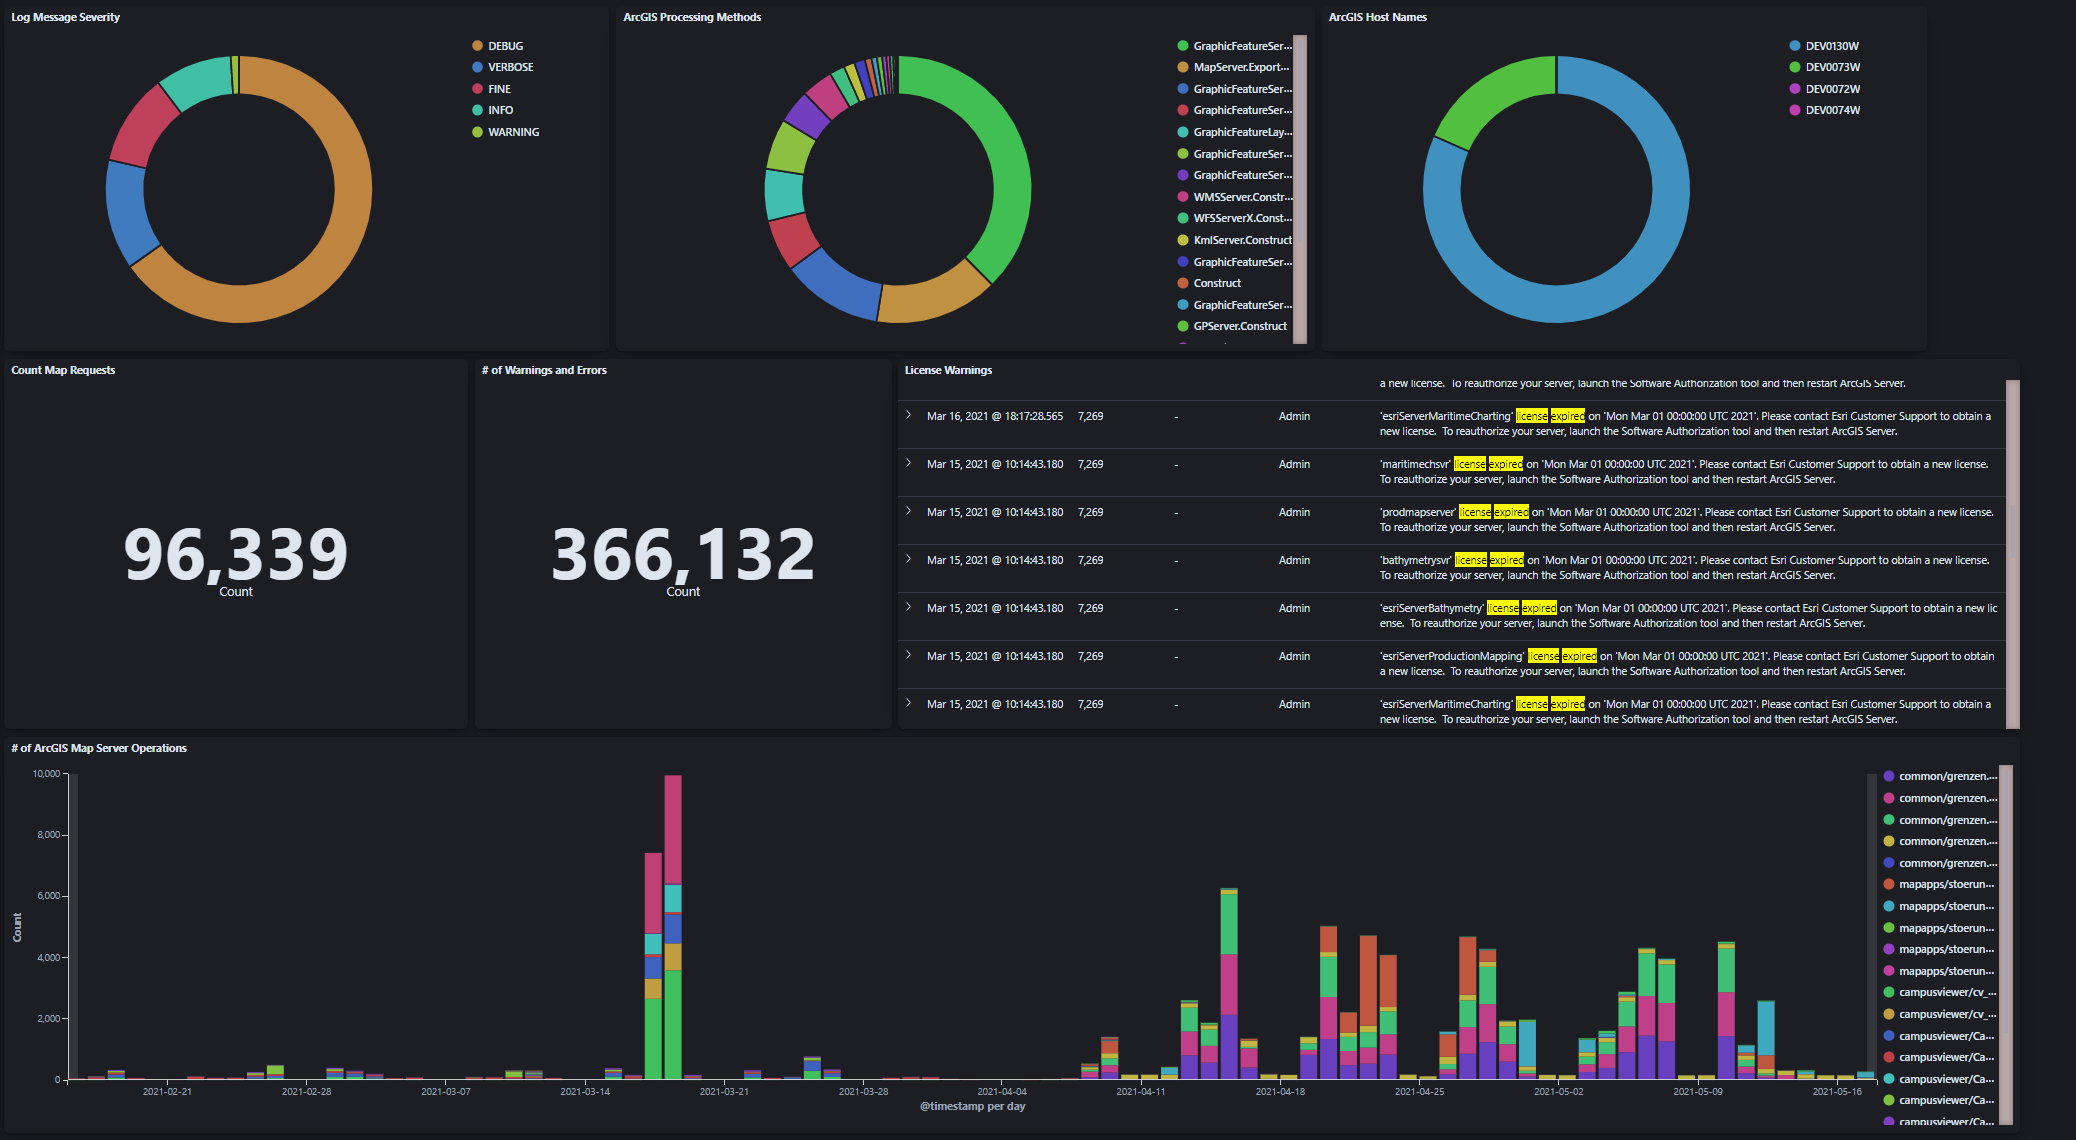
IT systems are becoming increasingly complex: in terms of how they are operated (virtualisation, containers), how granular their components are defined (e.g. microservices) and how ambitious the use cases are that a system should be able to solve. The increased complexity can be countered with information transparency, in that potentially all products and components involved in a geoIT solution transfer the information available to them (e.g. on use or on their operation per se) to a central instance. With clear, dynamic and interactive dashboards, this information can be centrally viewed, aggregated and statistically evaluated. service.monitor provides the necessary components and configurations to integrate ESRI ArcGIS Enterprise and con terra application logs inital.
User interactions
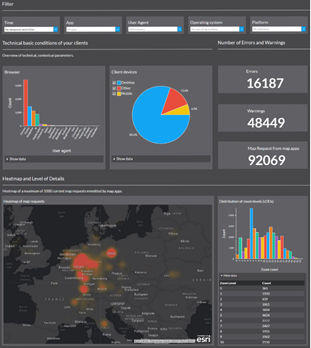
The interactive widgets, aggregated in clear dashboards, provide information on the frequency of service use, favourite functions, popular regions, content searched for or end devices used, among other things. A wide variety of filters enable a focussed use of the analysis functionality, e.g. for individual apps or specific end devices.
The insights gained in this way ultimately provide information on how the expansion of one’s own spatial digital service can be made more efficient and, above all, aligned with the actual requirements of the end users. This increases user acceptance and also ensures high cost efficiency.
Reliable monitoring of geo-services
The monitoring functions of the service.monitor enable the monitoring of different geo-affine service types (OGC, ArcGIS, FME, INSPIRE) in configurable time intervals. If the defined minimum standards for a service are not met, the person responsible is notified immediately by e-mail, SMS or webhook. In addition to the monitoring and notification functions, extensive options for statistical evaluation are available. Response time behaviour, key figures on availability or error messages/warnings can be displayed directly online, as a report or in a clear MS Excel presentation. In addition, there is the option of transferring the recorded data to the analytics area of the product in order to be able to analyse the data on Kibana dashboards.
The monitoring can be integrated into various infrastructures and applications via Rest API. In addition, a status widget enables the simple integration of interactive diagrams into external web applications.
All together - added value for GeoIT solutions
sservice.monitor integrates cross-sectionally into GeoIT solutions and can potentially collect information at all system levels, normalise it and make it available for later viewing and analysis in the service.monitor dashboards. Due to the open approach to integration (including, in particular, the use of the Elasticsearch stack), the product offers, in addition to standard use cases.
-
User interaction data from map.apps and security.manager
-
log data
-
from con terra products
-
from Esri ArcGIS Enterprise
-
from Safe FME Server
-
-
visualisation and aggregation of monitoring data
A wide range of options to meet individual information and analysis needs at all levels of an IT system. Obvious integrations or extensions are:
-
Use of Elasticsearch Metricbeat
-
Integration of HTTP access log files
-
Log files from standard IT components (databases, containers, …)
-
Individual integrations with GeoIT software products
See functionality overview for more.