Dashboard configuration for Kibana
The new dashboards for Elastic Kibana are available as json files in the folder analytics/elasticsearch/kibana, divided into
-
ct-analytics -
ct-logfiles -
ct-arcgis-logfile -
ct-monitoring -
ct-fme
The files contain all configuration for the necessary objects in Kibana:
-
index pattern
-
queries
-
visualizations
-
dashboards
Procedure
-
Open Kibana and switch to the menu item Management
-
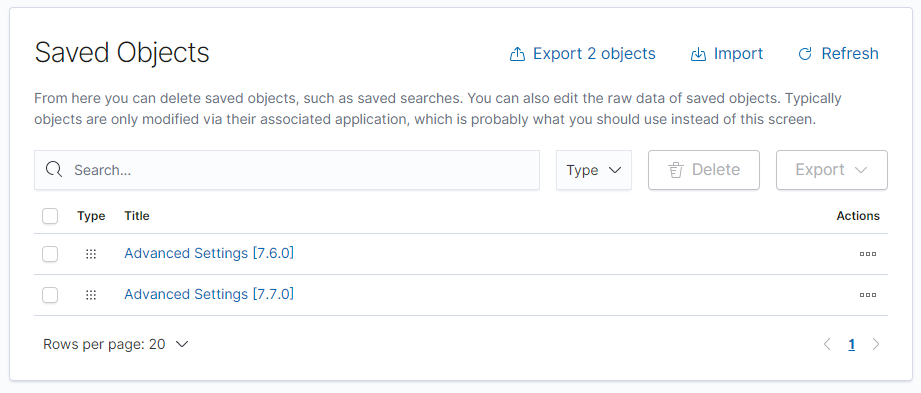
Navigate to section Kibana > Saved Objects
-
Locate and import the
jsonfile via the import dialog -
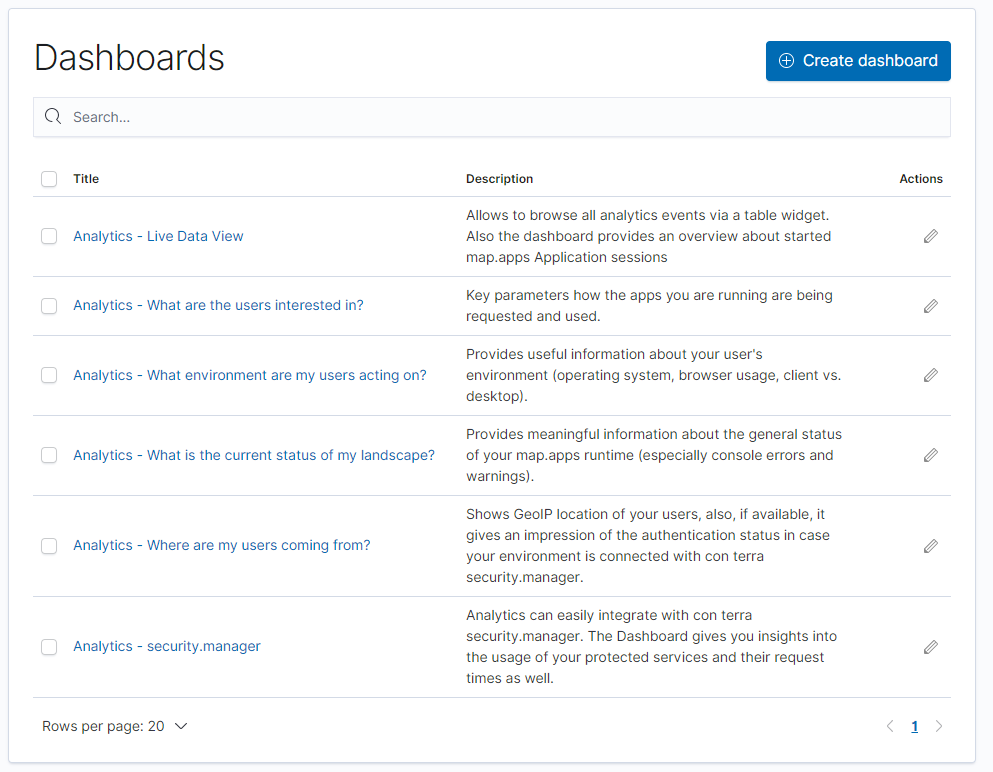
Click Dashboard in the left menu to view the imported dashboards
| The dashboards can only be imported successfully in Kibana {elastic_supported_versions_en}. |