Kibana Dashboard - Monitoring
Refine query
These Menus allow the refinement of the query thereby showing only data corresponding to a certain host, service, service type or job.

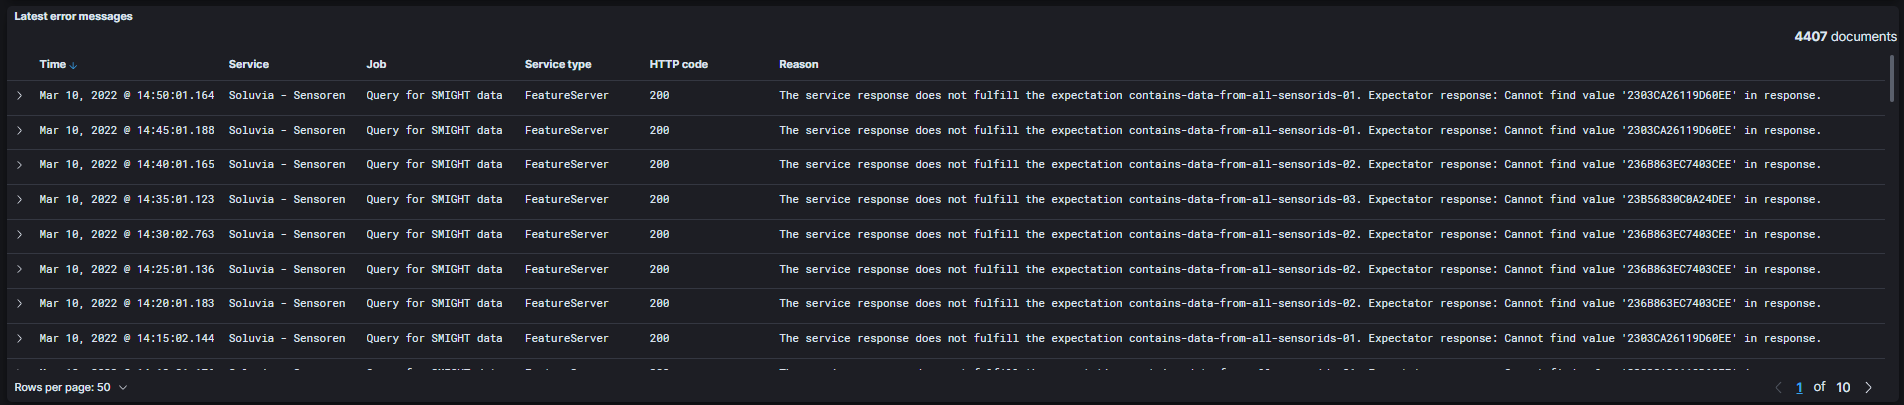
Latest error messages
The table lists current error messages along with their timestamp, the corresponding service, and the triggering monitoring job. The type of error can be inferred from the HTTP-code and the reason.
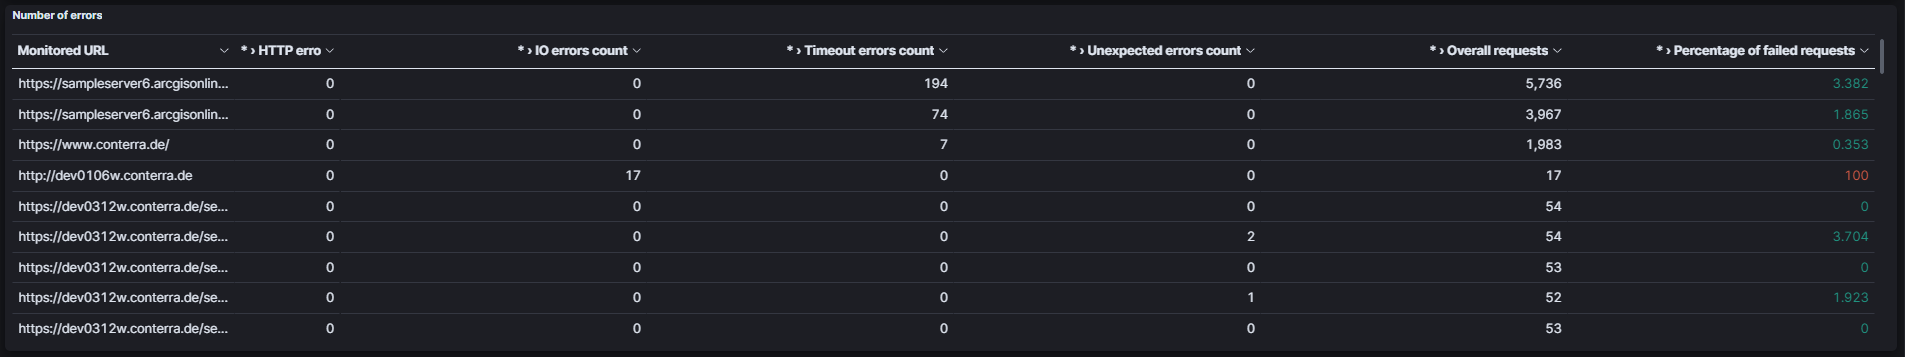
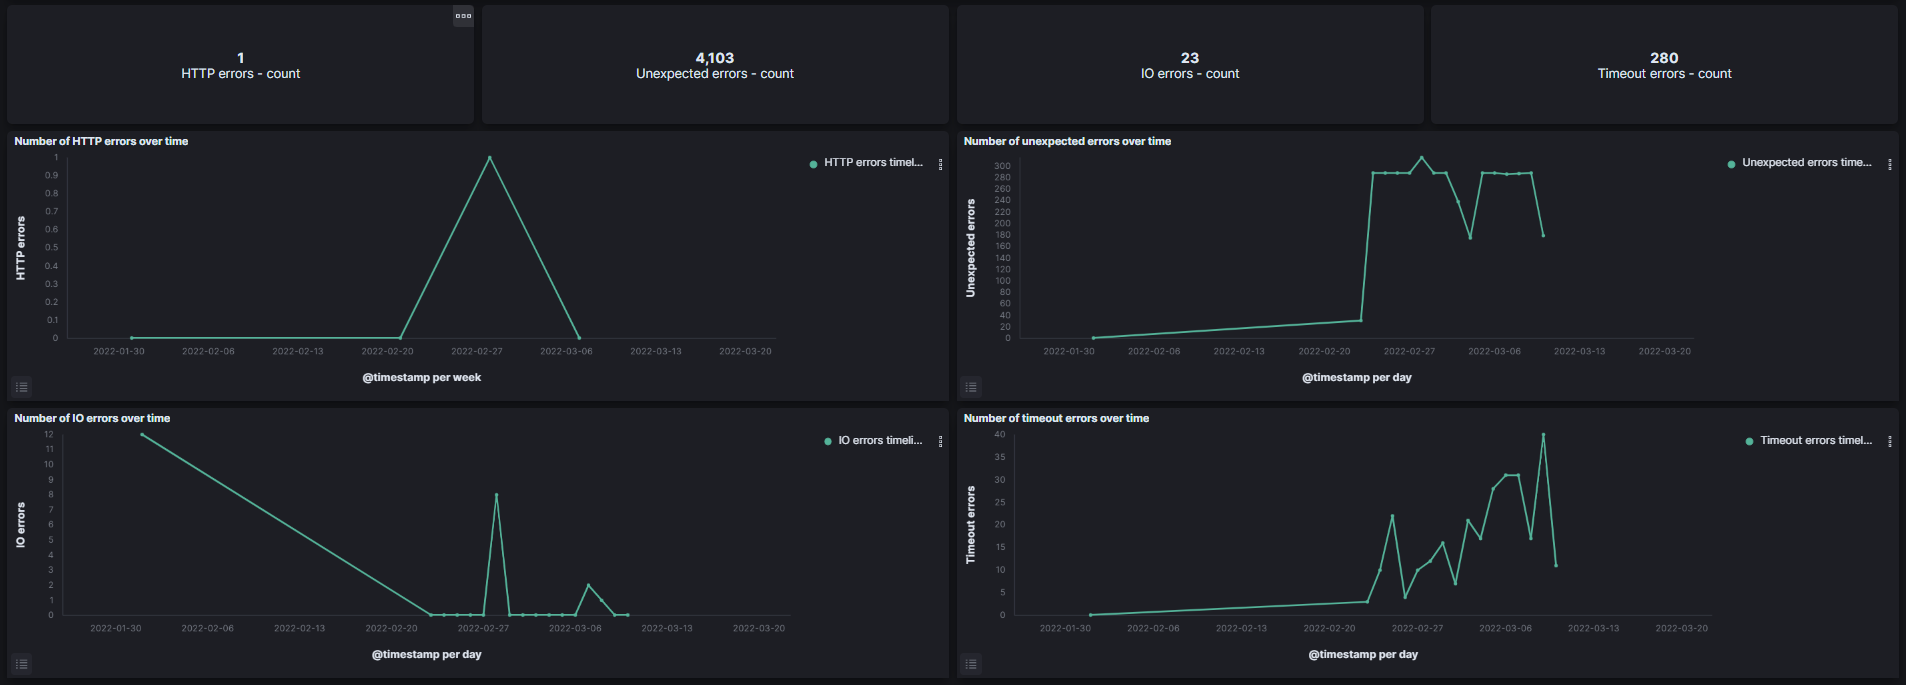
Error overview
The error-overview graphic display the absolute counts of errors by type. Additionally their timeline is shown. All information is divided into HTTP-, unexpected-, input-/output- and timeout-errors.
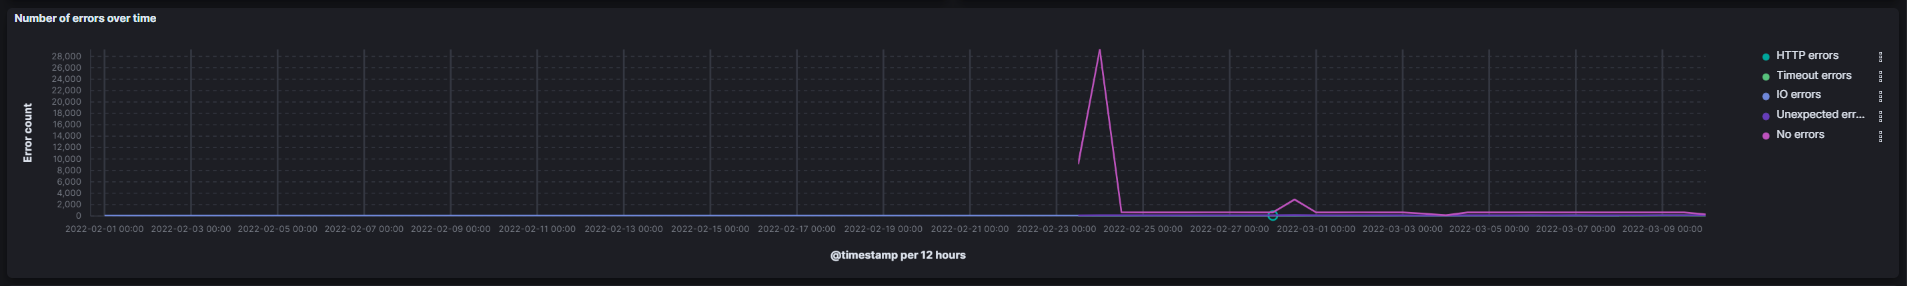
Number of errors over time
The diagram displays the development of the different error-types over time. Additionally the timeline of requests which resulted in no errors can be shown.
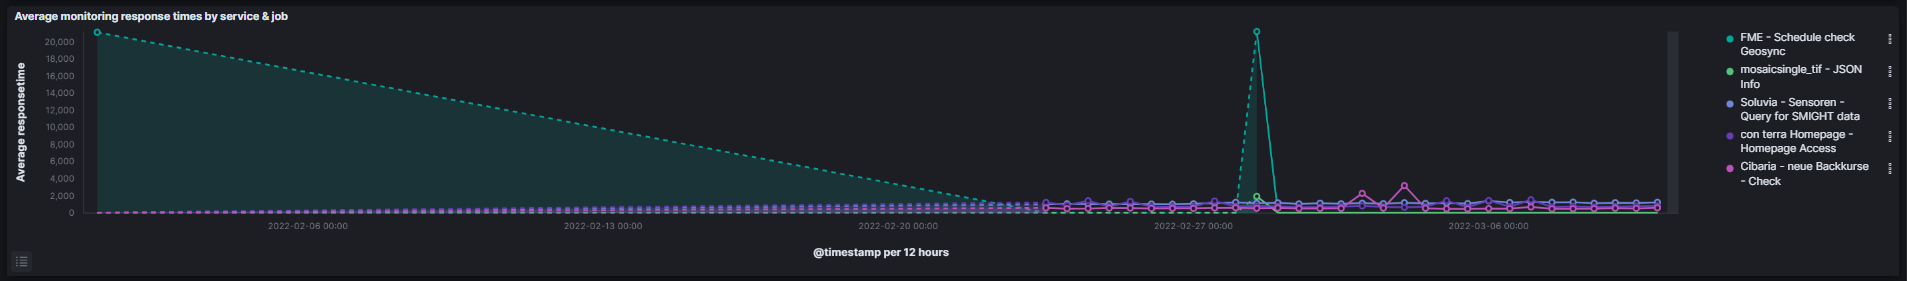
Average monitoring response times by services & job
This diagram displays the average response time by service and job over time.