Setting up Elasticsearch and Kibana for service.monitor
Essential parts of the Elasticsearch configuration can be done via Kibana.
The distribution contains files that ensure the integration of Elasticsearch and Kibana with service.monitor. On the one hand, this includes the configuration of the indices and index policies as well as the import of the Kibana dashboards.
The delivery directory contains the folder dev-console with files prepared for execution with the Kibana Dev Tools. The Dev Tools are located in the Management menu item of Kibana.
For each of the service.monitor supported data sources there is a file in the dev-console folder:
-
ct-analytics
-
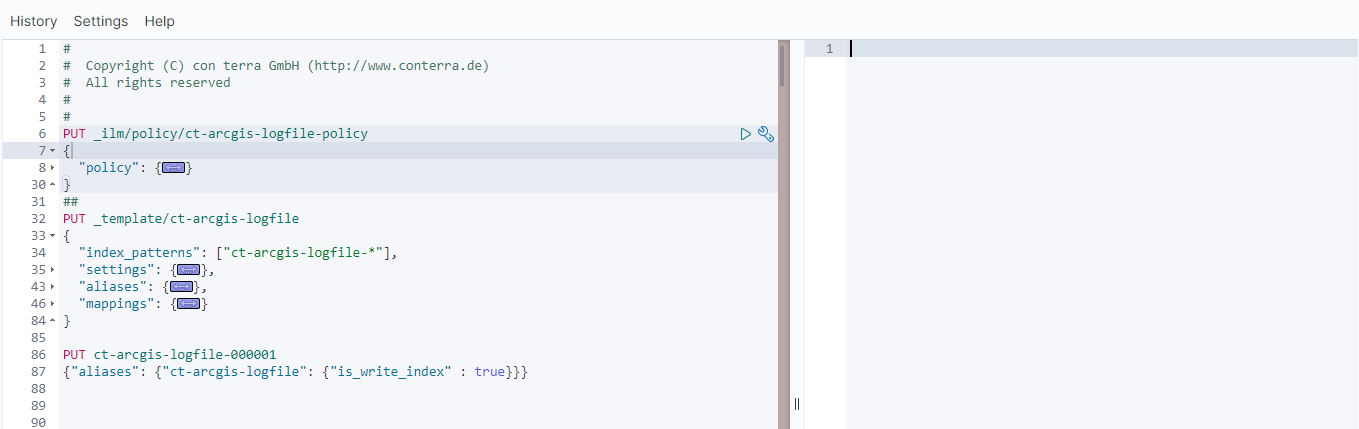
ct-arcgis-logfile
-
ct-fme-*
-
ct-log
-
ct-monitoring
Depending on which data sources are to be activated, the contents of the file are copied into the Dev Tools using copy + paste.
As a rule, there are three commands in each file:
-
Create the ILM Policy
-
Create the index template
-
Creating the Bootstrap Index
The sections are executed by clicking on the arrow symbol from top to bottom. Usually the success of an action is answered with acknowledged in the Dev Tools in the right window.
This procedure must be repeated for all data sources to be used.
| A better understanding of the interrelationships of the actions described here is provided by this overview |