System requirements
System requirements of web applications (/monitor and /monitor-analytics)
Java Runtime Environment
-
OpenJDK (JDK or JRE), versions 11*, 17
-
Oracle JDK, versions 11*, 17
|
Java 17 Note
When using Java 17, the following Java option must be added for Apache Tomcat:
|
Application server
-
Apache Tomcat 9.0
Make sure a recent version of Apache Tomcat is installed, accepting HTTPS connections at e.g. https://tomcat-host. HTTPS can be configured as described in the Tomcat User Guide .
Database (only Monitoring)
-
Oracle Database 18c*, 19c
-
Microsoft SQL Server 2019*, 2022
-
PostgreSQL 13*, 14
Browser
Latest stable version:
-
Google Chrome
-
Firefox
-
Microsoft Edge
-
Safari
|
General Hints
|
System requirements Elasticsearch
The products Elasticsearch and Logstash receive, process and store the collected events so that they can then be subjected to targeted research and analysis in Kibana.
Currently, these versions are required:
Full overview of Elasticsearch system requirements .
| For security and distribution reasons, it is recommended that you run these components on a separate host, independent of the application infrastructure. |
Compatibility with other con terra products
User interaction data collection in map.apps applications.
All map.apps line 4 applications can be enabled to send user interaction data through service.monitor bundles.
User interaction data collection in map.apps (server)
Currently, integration data for logging user interaction data with the server components of map.apps is available between map.apps version 4.7.0 and 4.13.
Architectural Considerations
Here are some basic recommendations you may follow when setting up service.monitor.
-
Run service.monitor applications separately from your applications - if your application server fails completely you are going to recognize this too late
-
Separate Elasticsearch and Logstash from your internet exposed applications - these are performing memory and cpu consuming operations.
-
Run Elasticsearch cluster with at least two nodes or be at least prepared for growing requirements
Memory and hard disk memory
The Elasticsearch components require resources for operation. The more data that needs to be processed, stored and searched, the more generously the system must be dimensioned. It does not make sense to stay below the minimum values mentioned here. However, the recommended values are only a recommendation based on current customer setups known to us. The operation of the Elasticsearch cluster must therefore be accompanied during the commissioning phase, especially with regard to these resource requirements. Index Lifecycle Management is used to ensure long-term operation.
| Memory (minimal) | Memory (recommended) | Hard disk (initial value) | |
|---|---|---|---|
Elasticsearch |
4GB |
8GB+ |
300GB |
Logstash |
1GB |
2GB+ |
1GB |
Kibana |
1GB |
2GB+ |
- |
Please see Set JVM options .
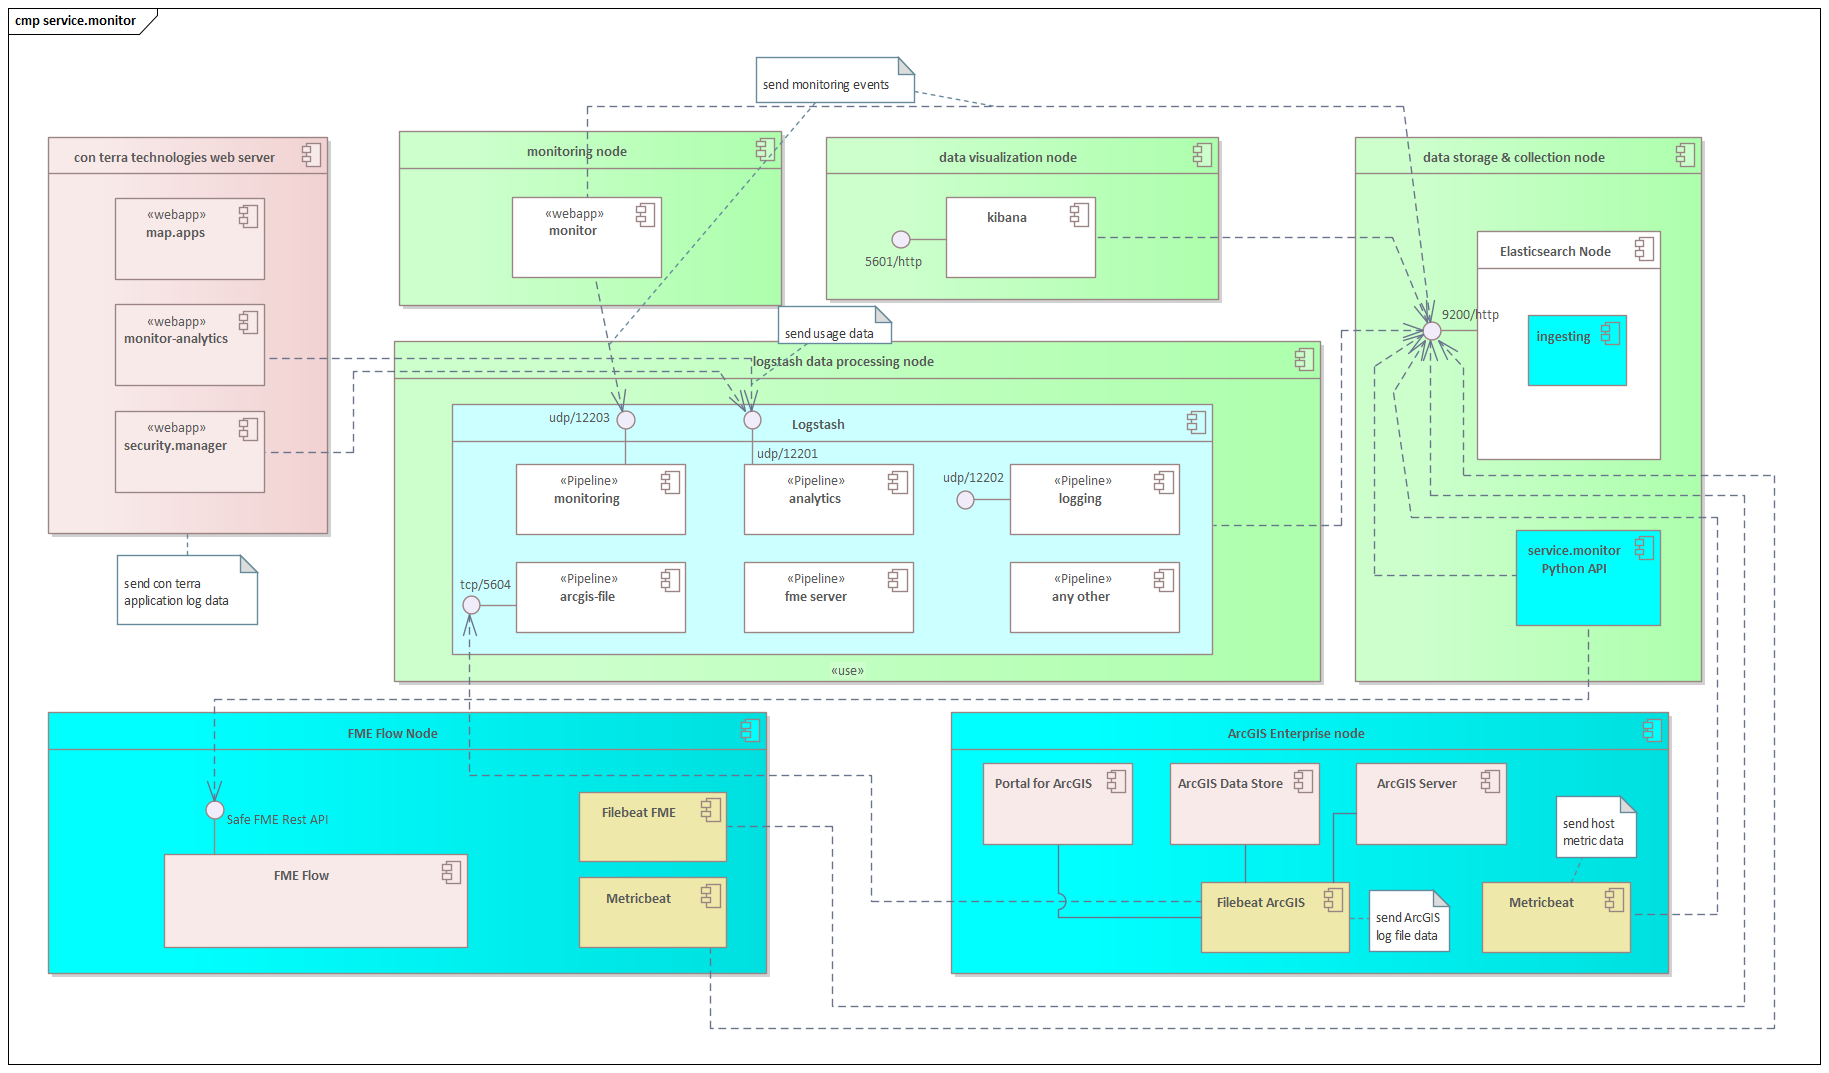
Port shares
| The ports mentioned here are either the default ports of the components used (Tomcat, Elasticsearch) or the ports that service.monitor uses as default ports (e.g. logstash pipelines). |
| data source/component | port/protocol | description |
|---|---|---|
/monitor |
8080/tcp |
Tomcat Http port of Monitoring webapp |
/monitor-analytics |
8080/tcp |
Tomcat Http port of Analytics webapp |
map.apps user interactions (logstash pipeline) |
12201/udp |
Host of Logstash process |
ct log data (logstash pipeline) |
12202/udp |
Host of Logstash process |
monitoring data (logstash pipeline) |
12203/udp |
Host of Logstash process |
ArcGIS Logs via Filebeat (Logstash Pipeline) |
5604/tcp |
Host of Logstash Process |
Kibana Server |
5601/tcp |
Host of Kibana process |
Elasticsearch |
9200/tcp |
Host of Elasticsearch processes |
SMTP (Mailing) |
25/tcp |
Port on mail server that needs to be accessible by /monitor webapp (example) |
Webhooks (Notifications) |
80/tcp |
Example of a port share on foreign server that should be accessible via a webhook notification (slack, teams) |