Introduction
The operation of a successful and comprehensive geoIT solution is composed of different aspects. Besides obvious issues of general system stability and stable (map) services with speedy response times, a clear transparency of the activities of all geo-specific architecture components is also part of it. Furthermore, the success of a digital service offering is linked to intuitive usability. This usually cannot be achieved ad hoc, but rather by means of several improvement cycles based on good data on actual user interactions.
service.monitor creates transparency necessary for this by continuously recording and analysing
-
operating data,
-
log files,
-
the quality of services and
-
user interactions.
Its results provide the necessary information for the targeted ongoing optimisation of your geoIT solution.
Analytics
Thanks to the analytics capabilities of service.monitor, providers of geo-services are able to quickly and comprehensively analyse the operation and usage of their applications. Modern web analytics methods of the component optimized for map.apps provide insight into the concrete behaviour of users — continuously, automatically and in compliance with data protection regulations. Furthermore, many software products and components involved in a geoIT solution can provide their information for a comprehensive, integrating analysis.
System and operational data
IT systems are becoming increasingly complex:
-
in terms of how they are operated (virtualisation, containers),
-
how granular their components are defined (e.g. microservices) and
-
how ambitious the use cases are that a system should be able to solve.
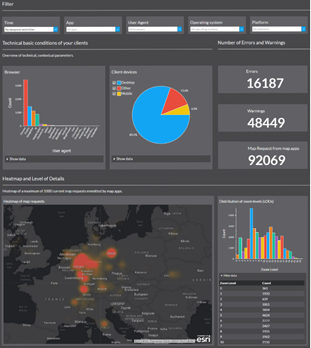
The increased complexity can be countered with information transparency. Potentially all products and components involved in a geoIT solution transfer the information available to them (e.g. on use or on their operation per se) to a central instance. With clear, dynamic and interactive dashboards, this information can be centrally viewed, aggregated and statistically evaluated. service.monitor provides the necessary components and configurations to integrate ArcGIS Enterprise and con terra application logs inital.
User interactions
The interactive widgets, aggregated in clear dashboards, provide information on
-
the frequency of service use,
-
favourite functions,
-
popular regions,
-
content searched for or
-
end devices used.
A wide variety of filters enable a focussed use of the analysis functionality, e.g. for individual apps or specific end devices.
The insights gained provide information on how to expand one’s own service more efficiently and, above all, align it with the actual requirements of end users. This increases user acceptance and also ensures high cost efficiency.
Monitoring
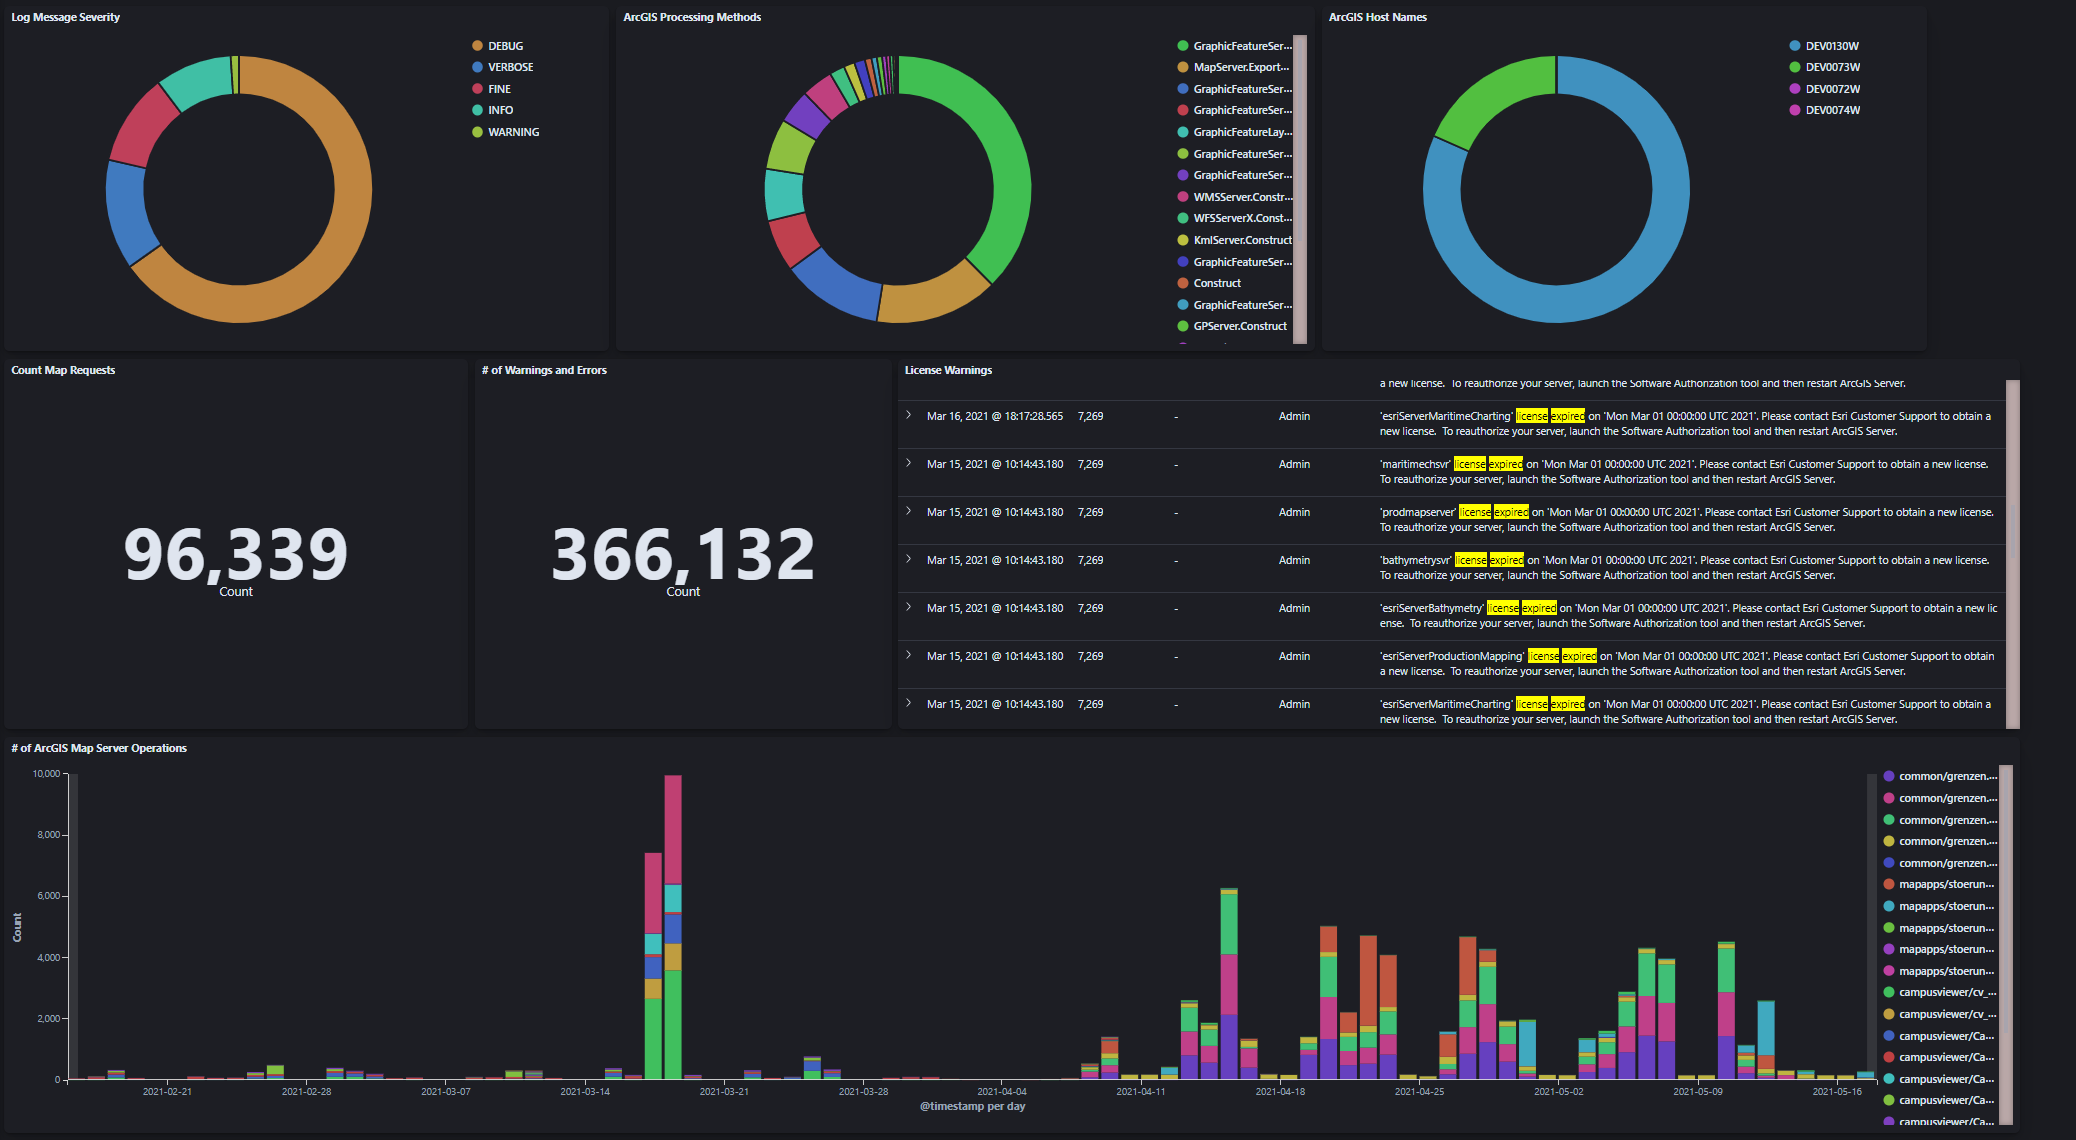
The monitoring functions of service.monitor enable the monitoring of different geo-affine service types (OGC, ArcGIS, FME, INSPIRE) in configurable time intervals. If the defined minimum standards for a service are not met, the person responsible is notified immediately by e-mail, SMS or webhook. In addition to the monitoring and notification functions, extensive options for statistical evaluation are available. Response time behaviour, key figures on availability or error messages/warnings can be displayed directly online, as a report or in a clear MS Excel presentation. In addition, there is the option of transferring the recorded data to the analytics area of the product in order to be able to analyse the data on Kibana dashboards.
The monitoring can be integrated into various infrastructures and applications via Rest API. In addition, a status widget enables the simple integration of interactive diagrams into external web applications.
All together - added value for GeoIT solutions
service.monitor integrates cross-sectionally into GeoIT solutions and can potentially collect information at all system levels, normalise it and make it available for later viewing and analysis in service.monitor dashboards. Due to the open approach to integration — including, in particular, the use of the Elasticsearch stack — , the product offers, in addition to standard use cases.
-
User interaction data from map.apps and security.manager
-
log data
-
from con terra products
-
from ArcGIS Enterprise
-
from FME Server
-
-
visualisation and aggregation of monitoring data
A wide range of options to meet individual information and analysis needs at all levels of an IT system. Obvious integrations or extensions are:
-
Use of Elasticsearch Metricbeat
-
Integration of HTTP access log files
-
Log files from standard IT components (databases, containers, …)
-
Individual integrations with GeoIT software products
Function overview
Analytics
-
Data collection in/from
-
con terra products - log data
-
map.apps/security.manager usage data
-
ArcGIS Server / Portal for ArcGIS - log data
-
FME Server
-
monitoring data
-
many more possible
-
-
Data analysis
-
to use map.apps Apps, Tools & Bundles, Search Expressions and Area of interests (and much more)
-
to understand the operation of con terra products
-
on aspects of the operation of ArcGIS Enterprise
-
on issues related to the use of FME Server
-
on the long-term development of services under monitoring
-
| Sub-area | Aspect | Explanation |
|---|---|---|
map.apps user interactions |
apps, tools, bundles, extents, clients, interaction flows |
all aspects of interaction. |
security.manager EE accesses |
use of protected services, accesses to the web applications |
all HTTP requests |
con terra applications: Log data |
log information of all con terra products (web applications) |
detailed information about the operation of con terra products |
ArcGIS Enterprise: log data |
log information of ArcGIS Server, Portal and DataStores |
detailed information about the operation of ArcGIS Enterprise components |
ArcGIS Enterprise: SOC processes |
Capture SOC process data via Elasticsearch Metricbeat |
detailed information about the use of system resources by ArcGIS SOC processes |
FME Server: Operational and Log Data |
Job Execution and Log Data |
detailed information about jobs, schedules and log data. |
service.monitor Monitoring |
information about all monitor job executions |
all information about service tests, ready for aggregation and analysis in Elasticsearch |
Monitoring
-
ensuring the availability of geo-IT related (HTTP) services
-
ArcGIS Server
-
OGC WMS/WFS/WCS (and more)
-
FME Server
-
con terra products
-
ArcGIS EGDB Direct Connect database connections
-
Elasticsearch Server
-
any HTTP endpoint
-
-
Broad support for easy creation of monitoring jobs
-
Harvesting of service URLs
-
Support via sample requests
-
-
Notification of service failures and errors via
-
Email
-
Twitter
-
SMS
-
Microsoft Teams and Slack
-
SNMP protocol
-
JSON Web hooks
-
-
Check the response of the server via
-
Standard response analysis
-
Service response time expectation.
-
Customised server response expectations such as.
-
contains string
-
regular expression matches
-
number of text occurrences
-
Checking HTTP response headers
-
-
Questions & added values
service.monitor can directly answer concrete questions through the capabilities described above and offers immediate added value for development, operation and management.
-
How many interactions are there in my GeoIT solution at the moment?
-
What is the response behaviour of my ArcGIS Server over the course of working days?
-
What error messages are currently logged in my GeoIT solution?
-
Where is the best time slot for my new planned FME job?
-
What is the average load of my FME Server Engines?
-
What is the percentage of failed ArcGIS requests?
-
Which Portal for ArcGIS items are found most frequently?
-
What is the long-term development of the response times of the services that are monitored?
-
How many requests are processed by security.manager?
-
Are there current messages about the licence status of ArcGIS Enterprise?
-
Are there many failed login attempts to the portal?