Kibana Rules
Overview
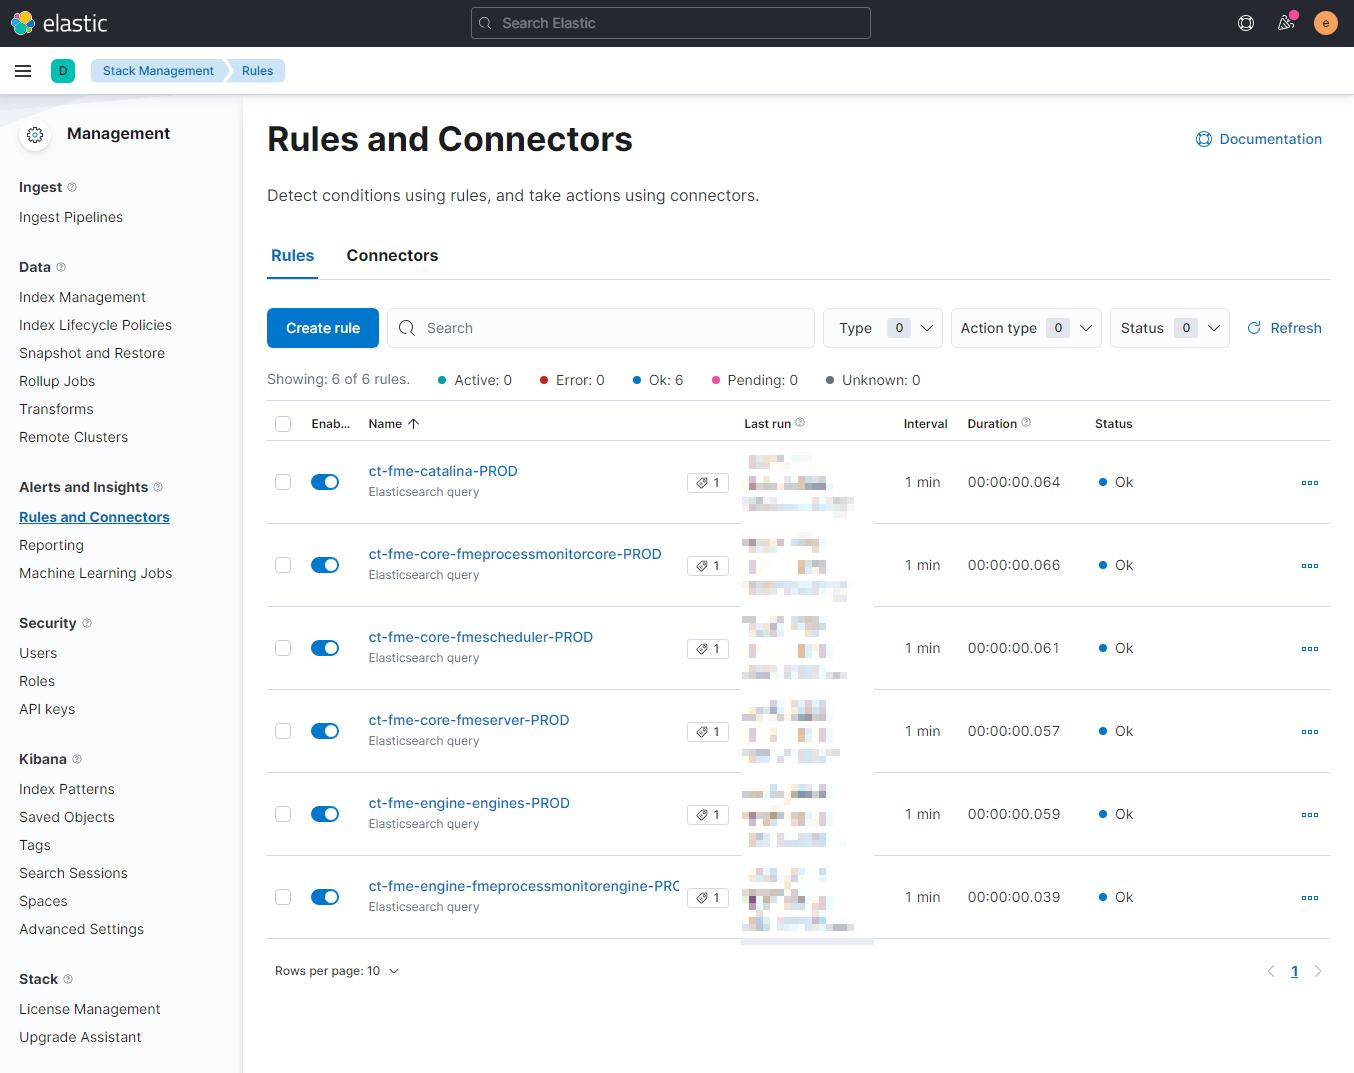
Under Stack Management > Alerts and Insights > Rules and Connectors the currently active rules and their state are displayed.
Create a new rule
Name and basic properties
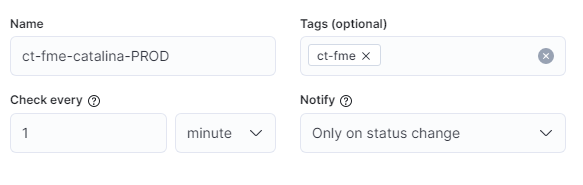
When defining the name, it must be ensured that it begins with ct-, otherwise it is not possible to view it in service.monitor Monitoring and link it to the notification templates there. The more rules are created, the better and more unique the naming should be. Tags can also be assigned to help in the later search for rules.
Check every-
Execution frequency of the query defined in the rule.
Default value:
1 minute. Notify-
Definition of how often the action (see below) should be repeated when the rule is active.
Default value:
Only on status change
Types of queries
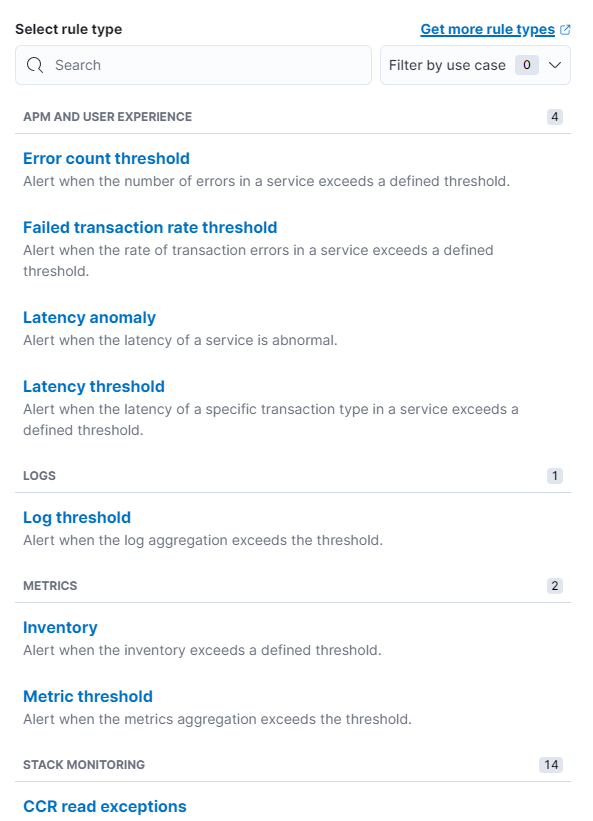
There are many different queries that target the different areas of Elasticsearch & Kibana. In our examples, we opt for the "Elasticsearch query".
Elasticsearch query & matches
To define the query, an index or alias must be selected. In this example we are talking about the index ct-fme-log, which contains the log lines from Safe FME Server as events.
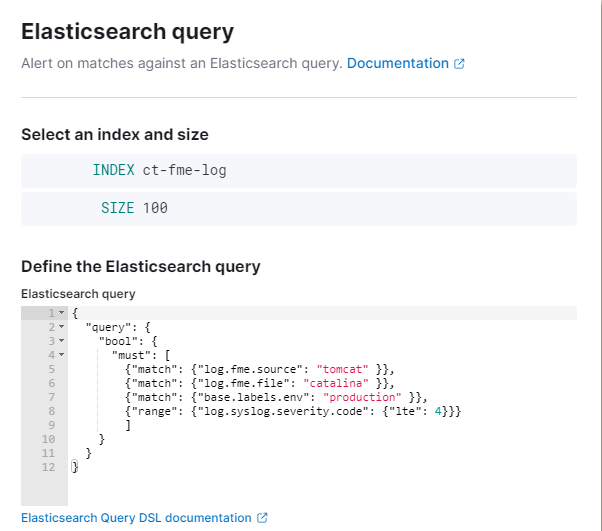
The specific query to be executed on a regular basis can be freely defined. The sample query asks for all events that are present in the context of FME Server through Apache Tomcat on the production server with a syslog level of ⇐ 3.
The service.monitor pipelines translate all textual log levels to the syslog standard. It is also possible to create a query that queries [log][level]: "WARNING" for example.
|
{
"query": {
"bool": {
"must": [
{"match": {"log.fme.source": "tomcat" }},
{"match": {"log.fme.file": "catalina" }},
{"match": {"base.labels.env": "production" }},
{"range": {"log.syslog.severity.code": {"lte": 3}}}
]
}
}
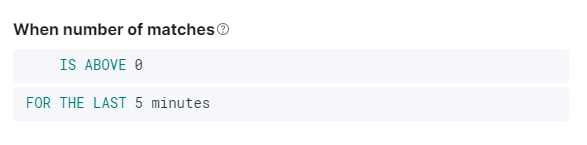
}Finally, it must be defined when the rule is to become "active". Since the occurrence of log messages with a critical level should be considered as a trigger, the value '0' is defined as the threshold for activation in the next step.
Action (optional)
Actions are not mandatory for setting up the notification function in service.monitor.
In the example below, an action has been defined which, when the rule is activated, writes an entry to an index intended for long-term storage of exceptions.
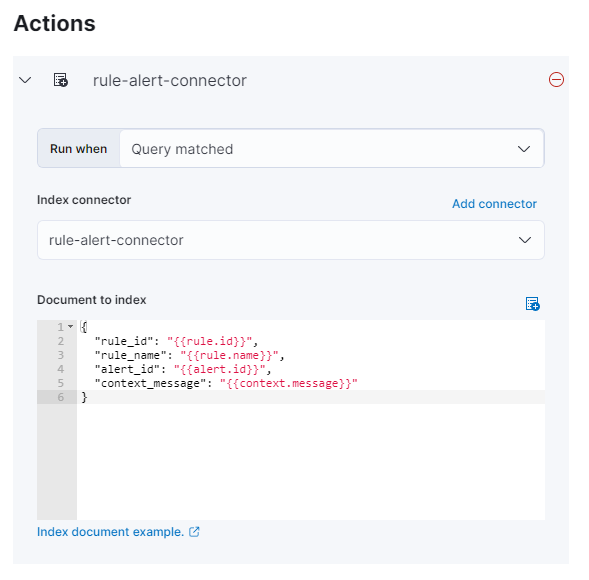
{
  "rule_id": "{{rule.id}}",
  "rule_name": "{{rule.name}}",
  "alert_id": "{{alert.id}}",
  "context_message": "{{context.message}}"
}
Examples of Rules
-
Notify me if there were more than n failed logins to Portal for ArcGIS.
-
Notify me when disk space for indexes becomes too small
-
Notify me when ArcGIS Server logs many error messages
-
Notify me when con terra products stop sending log data
| Queries for these examples will be available here in the future. |